Real-time data visualization in Grafana
While DracalView allows you to instantly visualize real-time data from Dracal USB sensors connected to your computer, it is not currently possible to display multiple graphs simultaneously in the software, or in other words, to create multiple parallel visualizations. Fortunately, Dracal products have been designed to enable their data to be easily and quickly integrated into other professional software, such as Grafana.
Grafana is a powerful data visualization tool, specially designed for data analysis and display. Below we’ve provided an extremely concise, fully illustrated tutorial to show you how to quickly create dashboards in Grafana with your Dracal data.
1. Download DracalMetricsExporter
Our team has prepared a small tool, named DracalMetricsExporter, to help you set up real-time visualization of our sensors in Grafana. To get started, download the appropriate version of the DracalMetricsExporter tool:
 Multi-platform (Requires installation of .Net 8)
Extract the contents into your desired folder.
Make sure your sensor is properly connected, then start the DracalMetricsExporter.exe program. Accept the firewall permission prompt twice.
Important: The program must remain open for this tutorial to work. Keep it open and remember to restart it for future sessions.
By default, the program uses port 8085 on your computer. If this port is unavailable, the program will display an error message and will not work. You will need to change the configuration port as follows.
1.1. Change the port (optional)
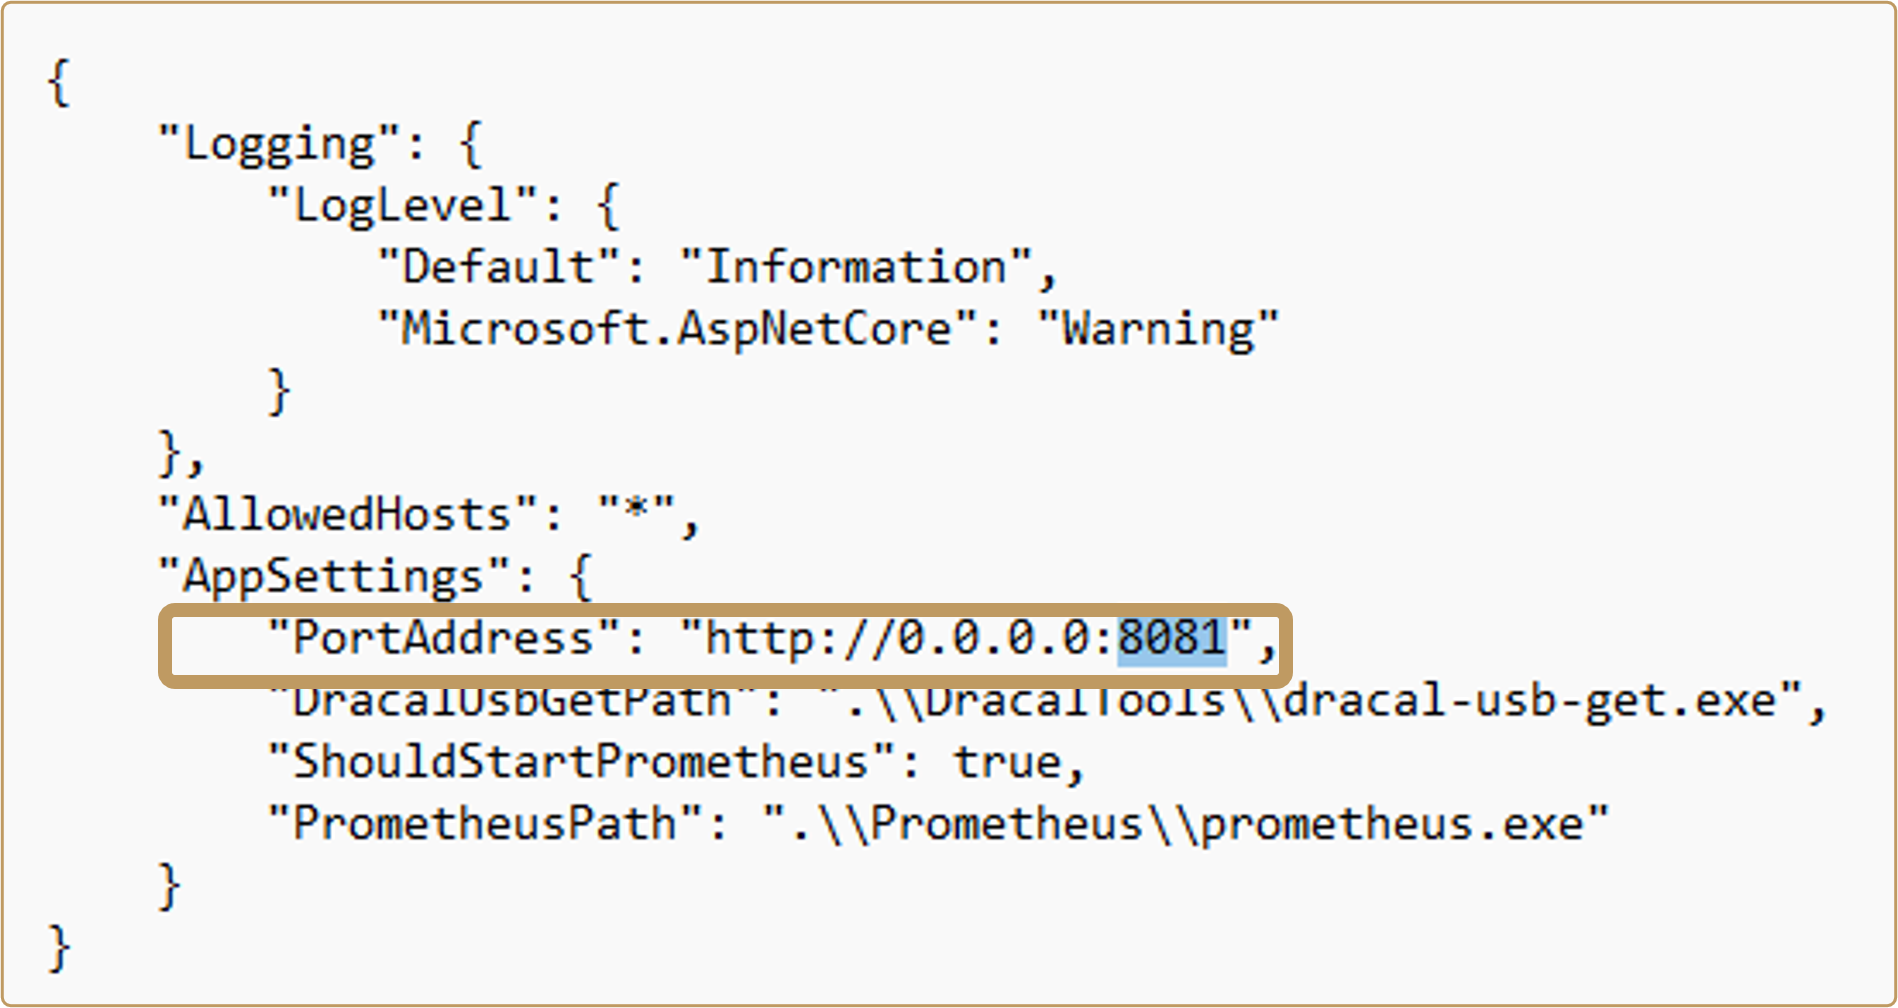
Go to the folder where you installed DracalMetricsExporter. Open the appsettings.json file with a text editor (e.g., Notepad). In the “PortAddress” section, change 8082 to another available port, such as 8081. Save the file.
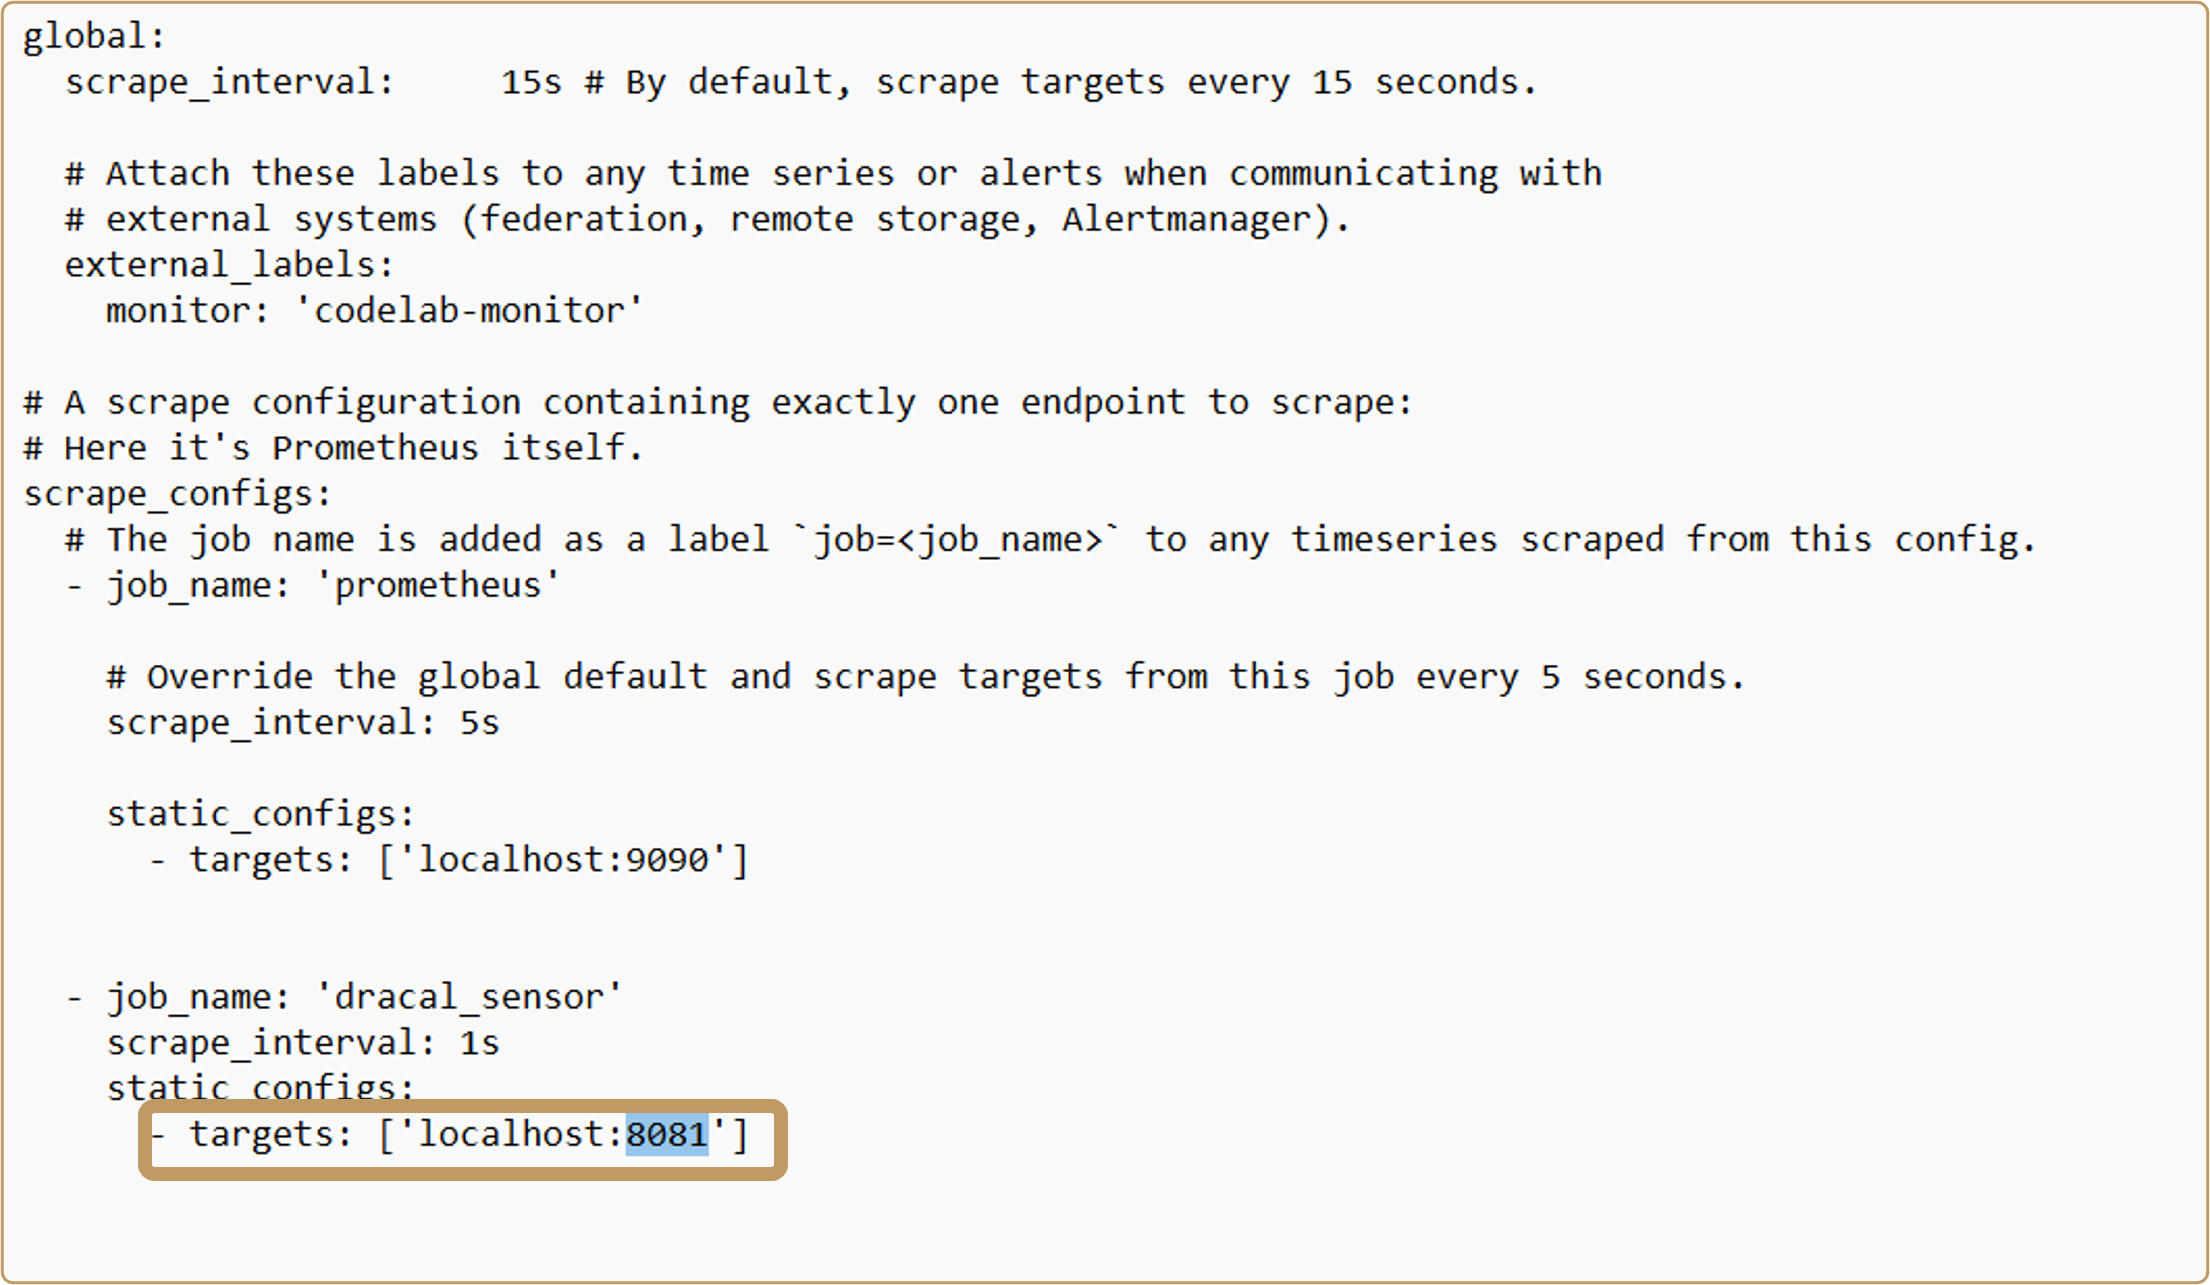
Still in the same directory, open the “Prometheus” folder, then open the prometheus.yml file with a text editor. In the “dracal_sensor” section, change the port 8085 to the one you selected, e.g., 8081. Save the file.
1.2. Check if data is being collected
Launch DracalMetricsExporter. You should see a window open automatically like this:
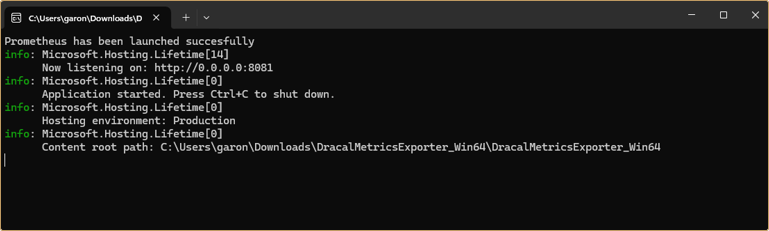
When the program is running, the data is converted into a format readable by Grafana. While not very human-readable, you can still check if data collection is working by visiting the local page http://localhost:8085/metrics (or http://localhost:[port]/metrics if you changed the port) in your web browser. If text appears, everything is working correctly.
2. Download Grafana
Grafana offers a free version that runs on a computer and a paid version that runs online. The paid version is not necessary in this case.
Download the free version of Grafana (OSS, Open-source software). Follow the installation instructions for your operating system.
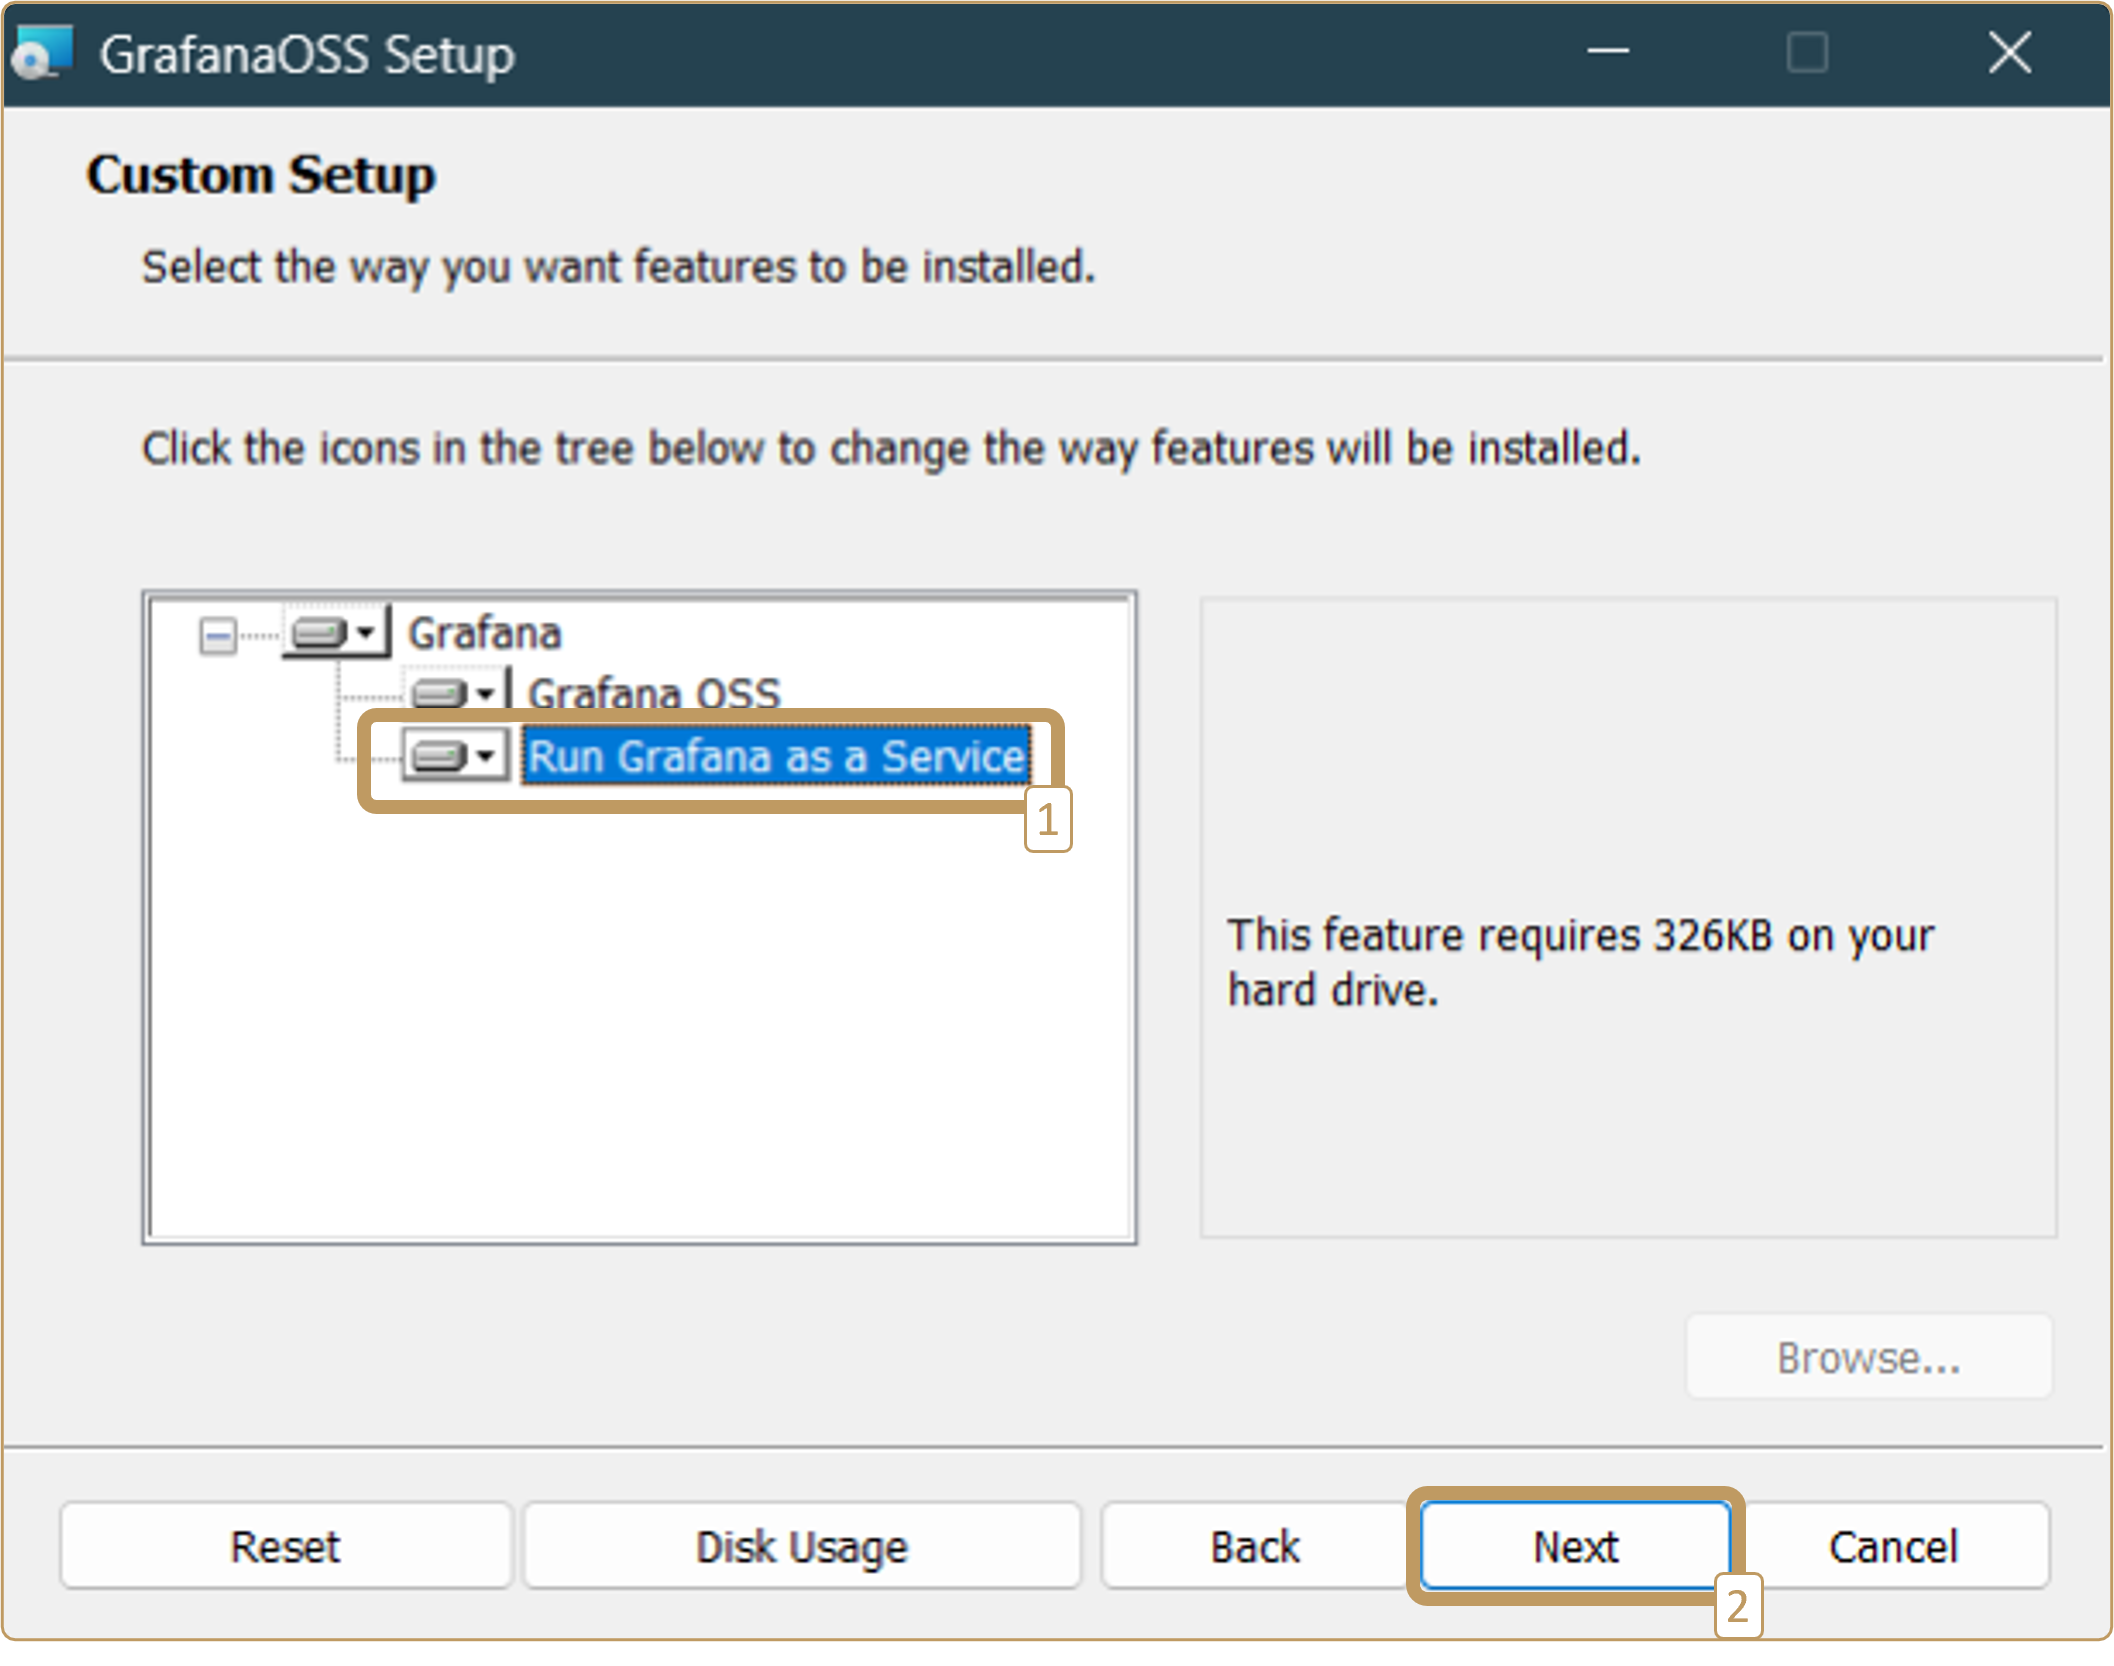
If you are using Windows, we recommend installing the “Run Grafana as a Service” component during the “Custom Setup” step, which allows Grafana to start automatically:
2.1. Change refresh rate (if needed)
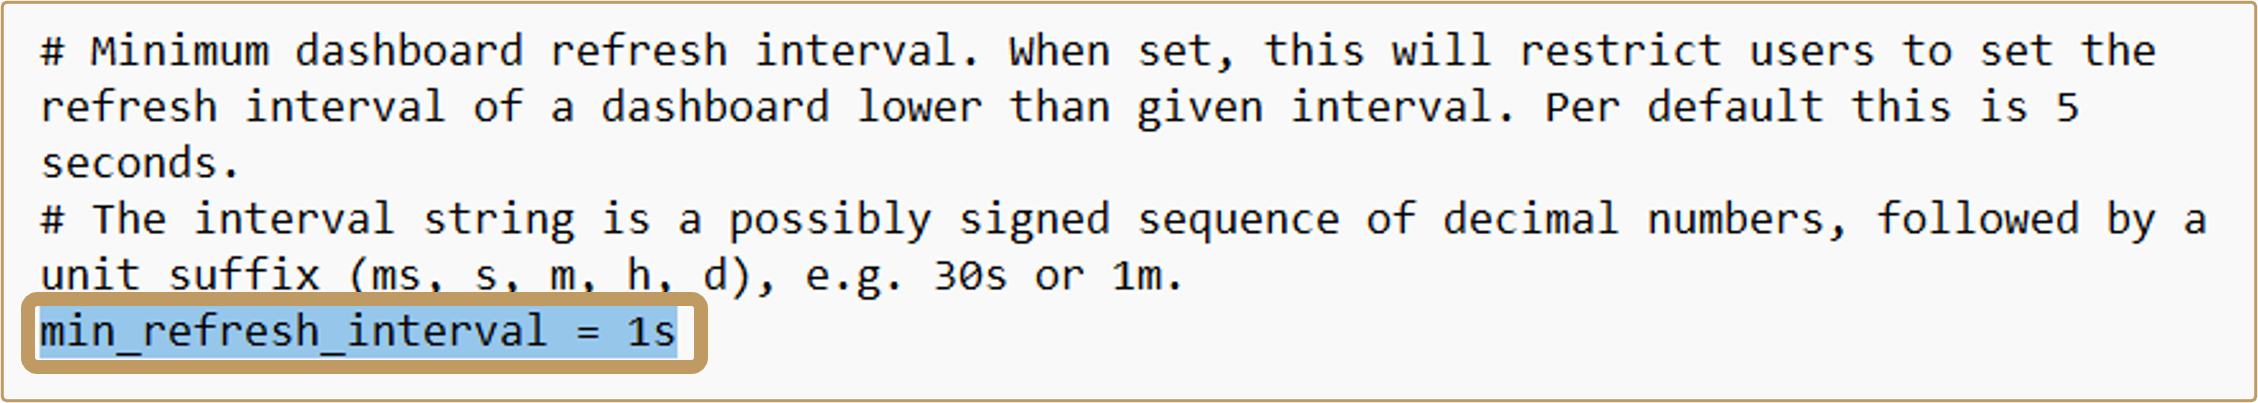
You can adjust how often Grafana updates the graphs. By default, the minimum refresh rate is 5 seconds. If you need a shorter interval, you must modify Grafana’s settings. Here’s how:
Go to the following folder: “C:Program FilesGrafanaLabsgrafanaconf”.
If the file “Custom.ini” is not present, create a copy of “sample.ini” and rename it “Custom.ini”.
Open “Custom.ini” with Notepad or another text editor.
Note: You need administrator rights to modify this file. If your system denies permission, copy the file to your desktop, make the changes, then move it back to the original folder.
Search for “min_refresh_interval” using “ctrl+f”. Uncomment the line (remove ;) and change it to “1s“:
Save the file and move it back to the correct location if needed.
3. Using Data in Grafana
Access Grafana locally in your web browser using the address http://localhost:3000/. Log in with the default username “admin” and the default password, which is also “admin”.
3.1. Connecting Grafana to Data
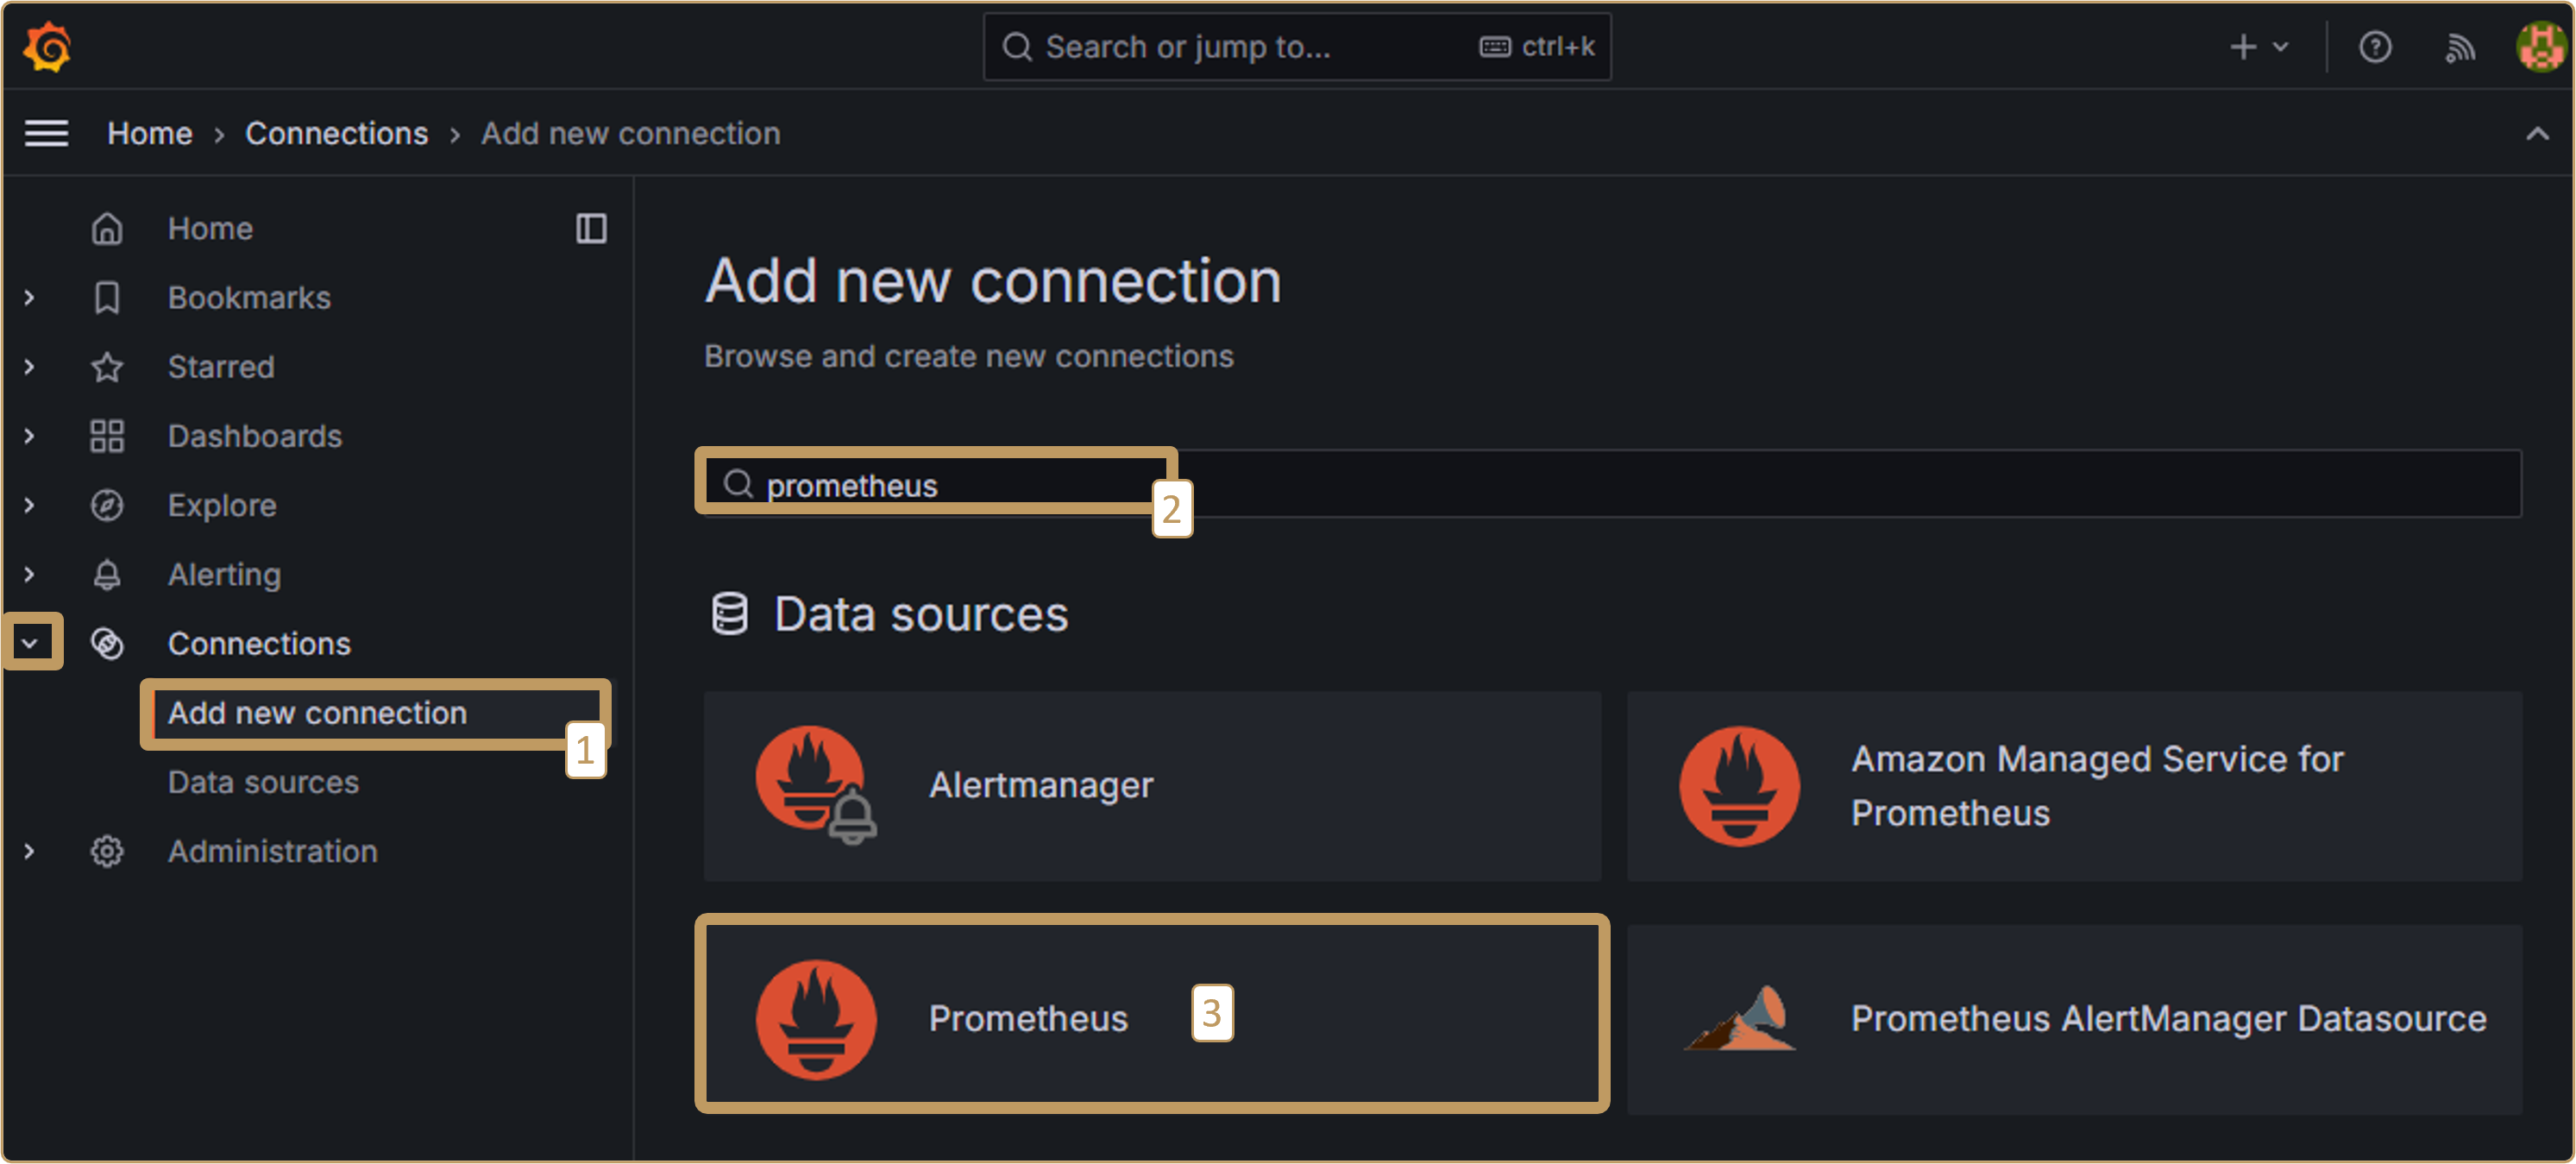
In the left navigation bar, click on “Connections”. Search for and select “Prometheus”:
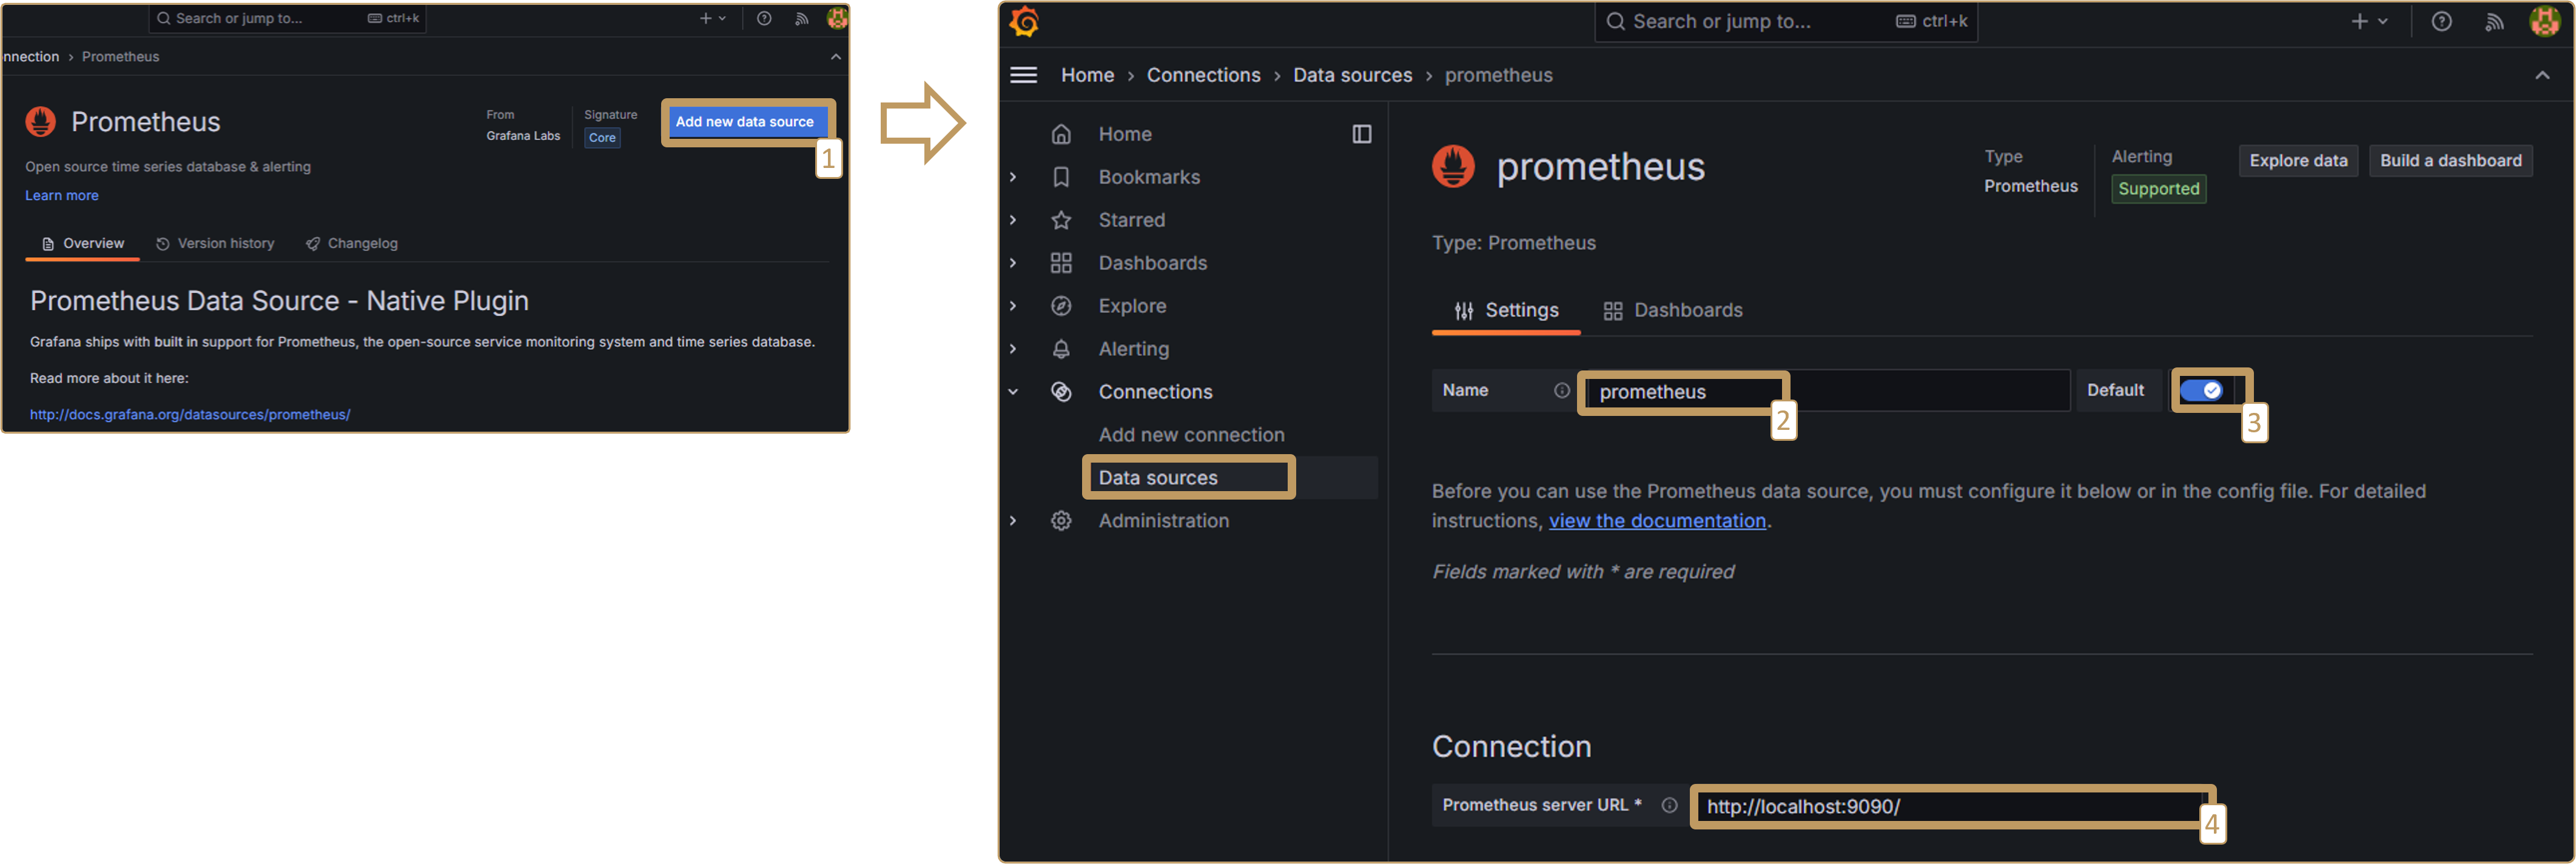
Click on “Add new data source”. Choose “Prometheus”, check “Default”, and enter http://localhost:9090/ as the URL:
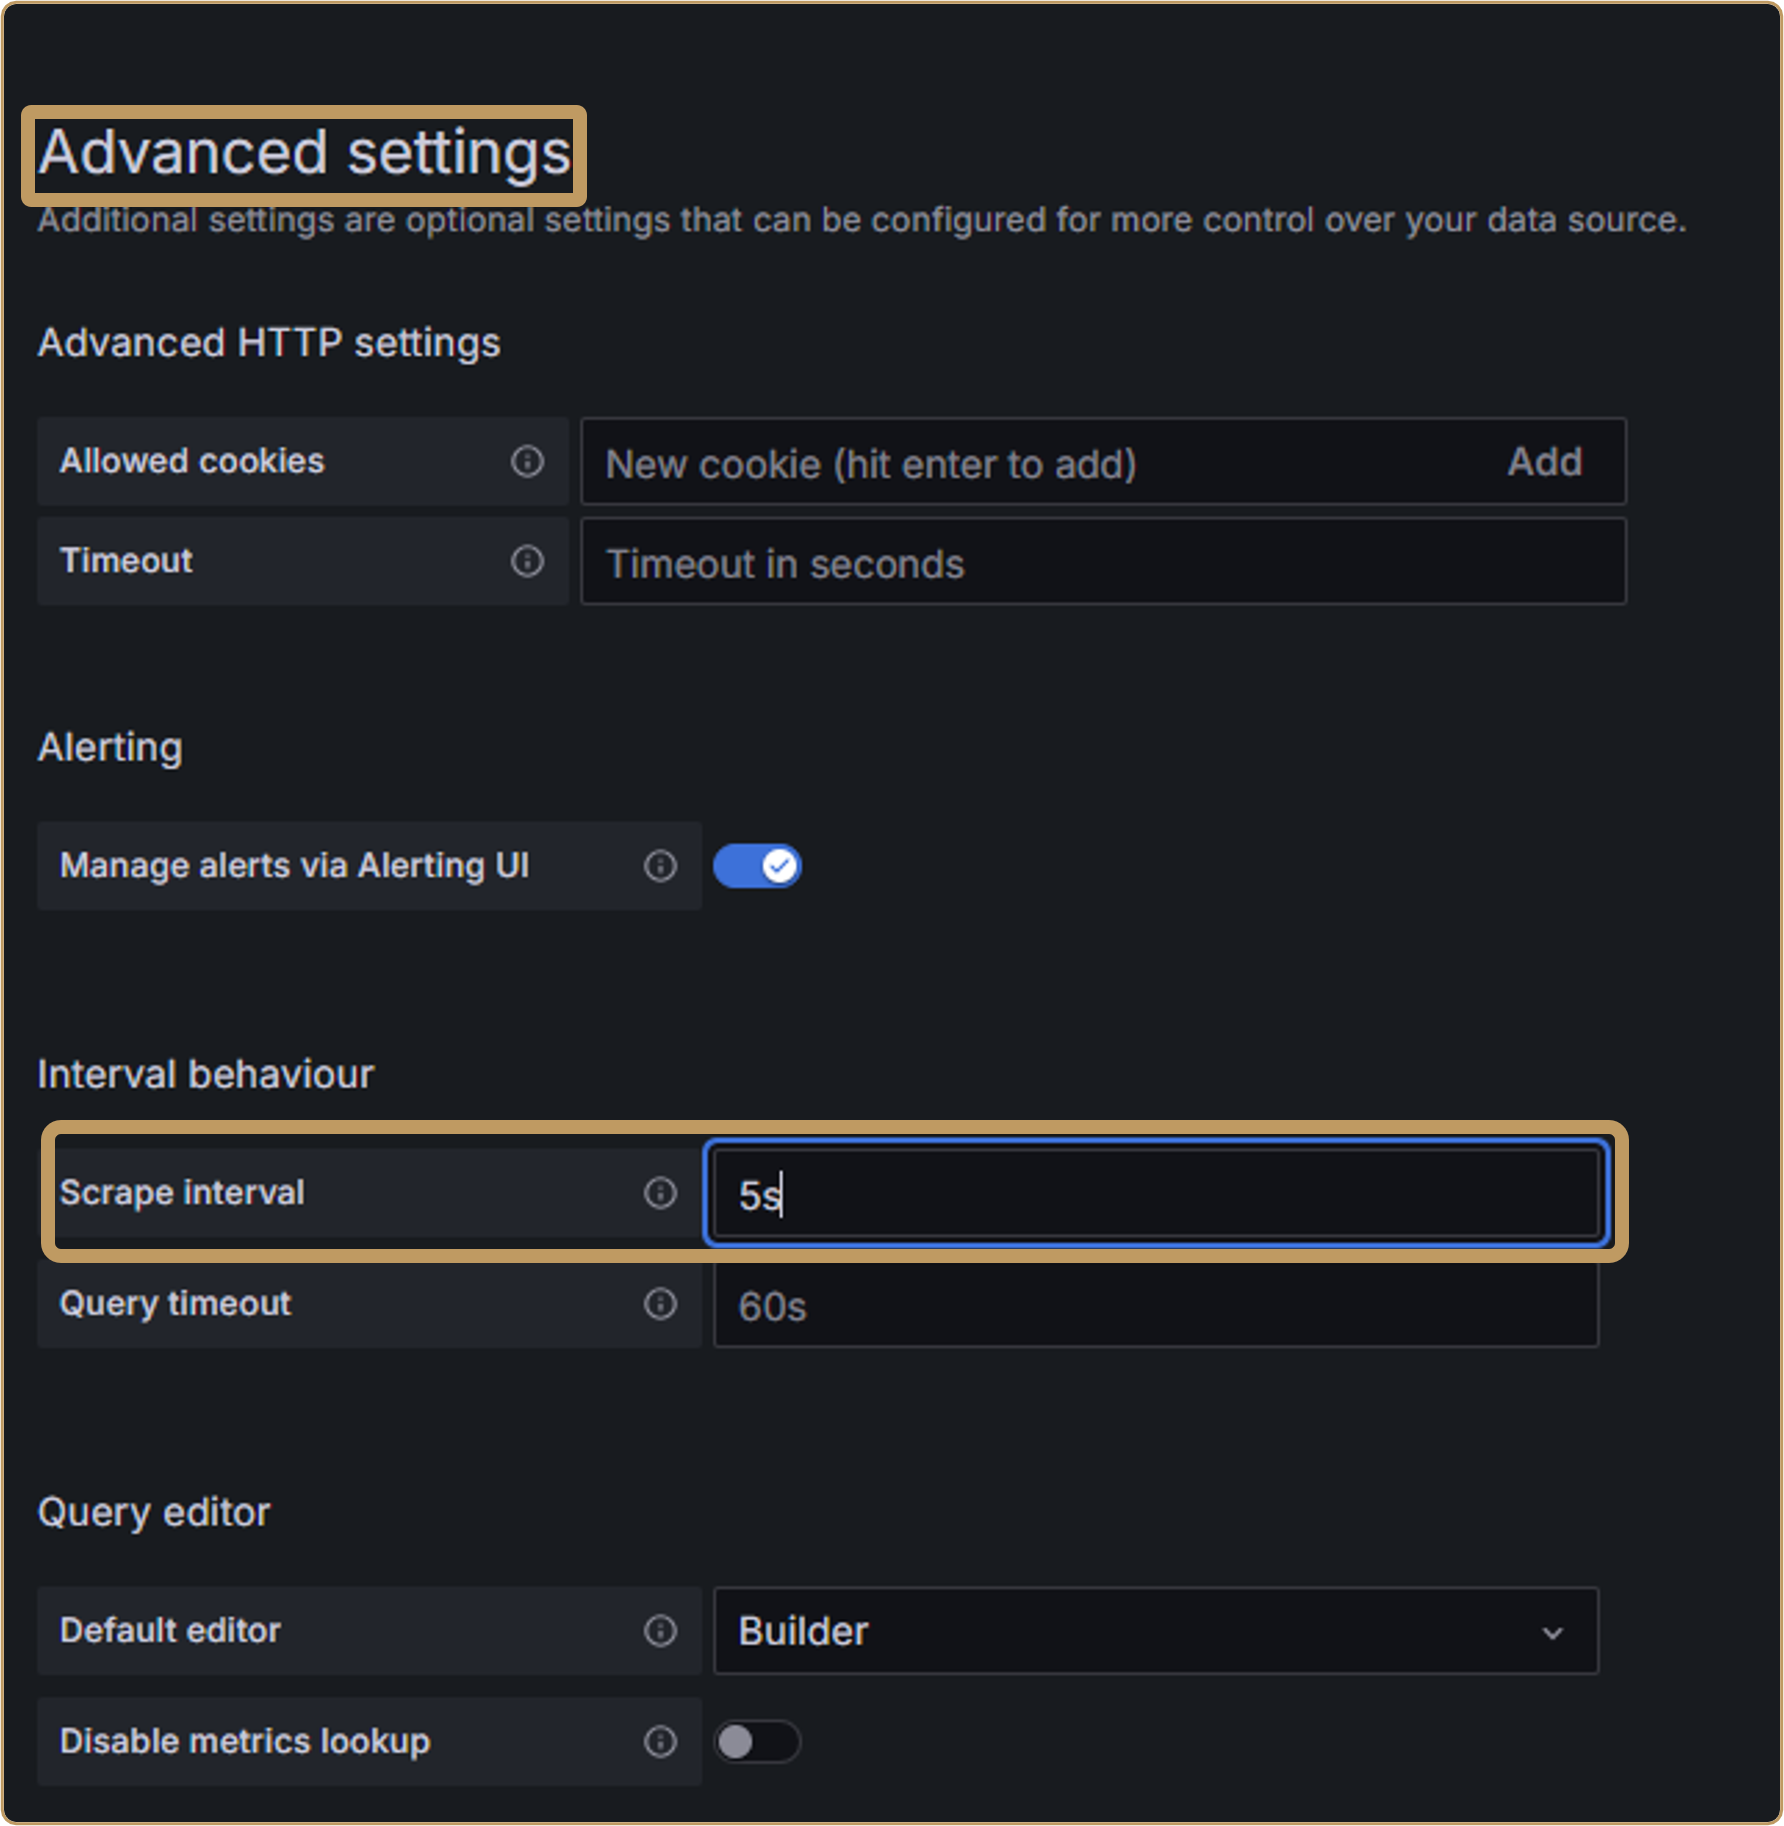
Under “Advanced Settings,” change the “Scrape Interval” to the desired duration. This value determines how often data is retrieved. For example, if you want your chart to update every 5 seconds, set it to 5 seconds or less:
You don’t need to change anything else. Save your settings.
3.2. Creating a Dashboard
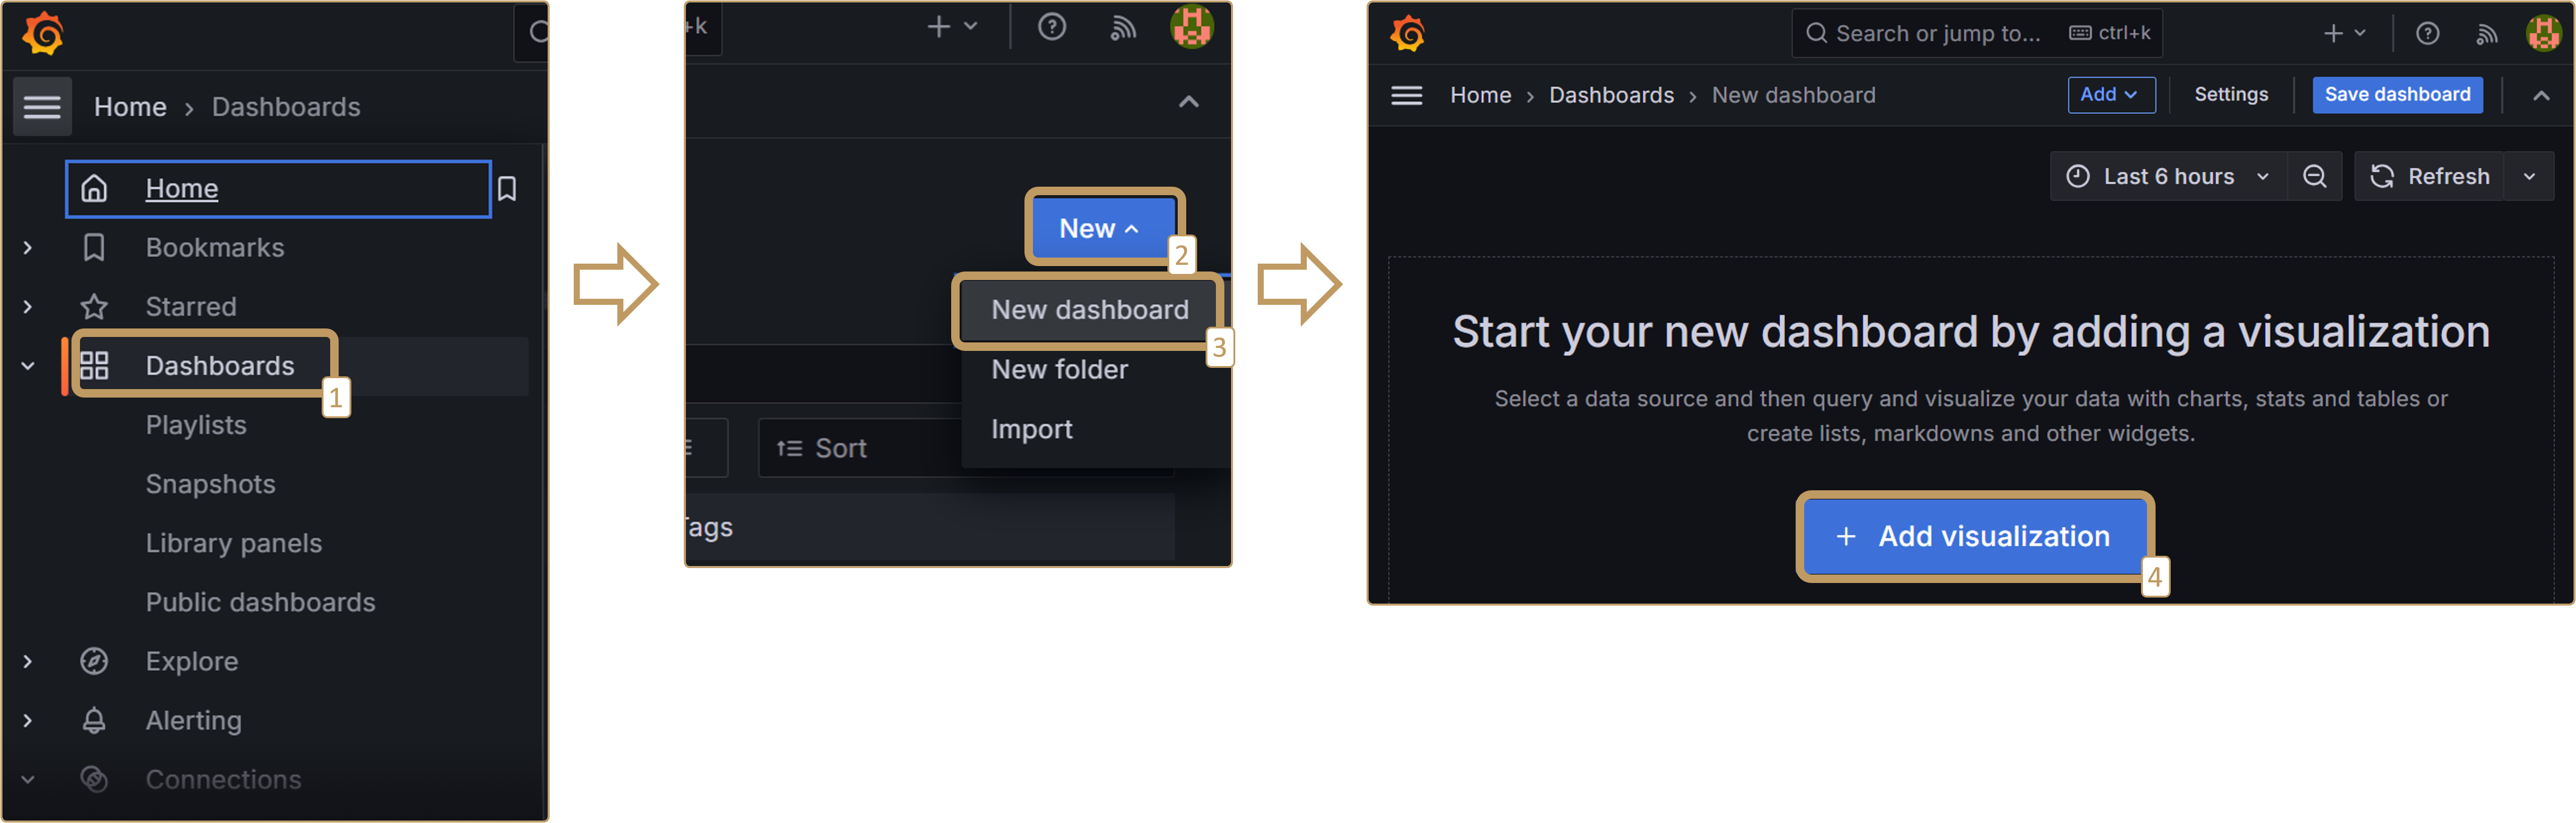
In the left navigation bar, click on “Dashboard” -> “New” (blue button at the top right) -> “New dashboard” -> “Add visualization”:
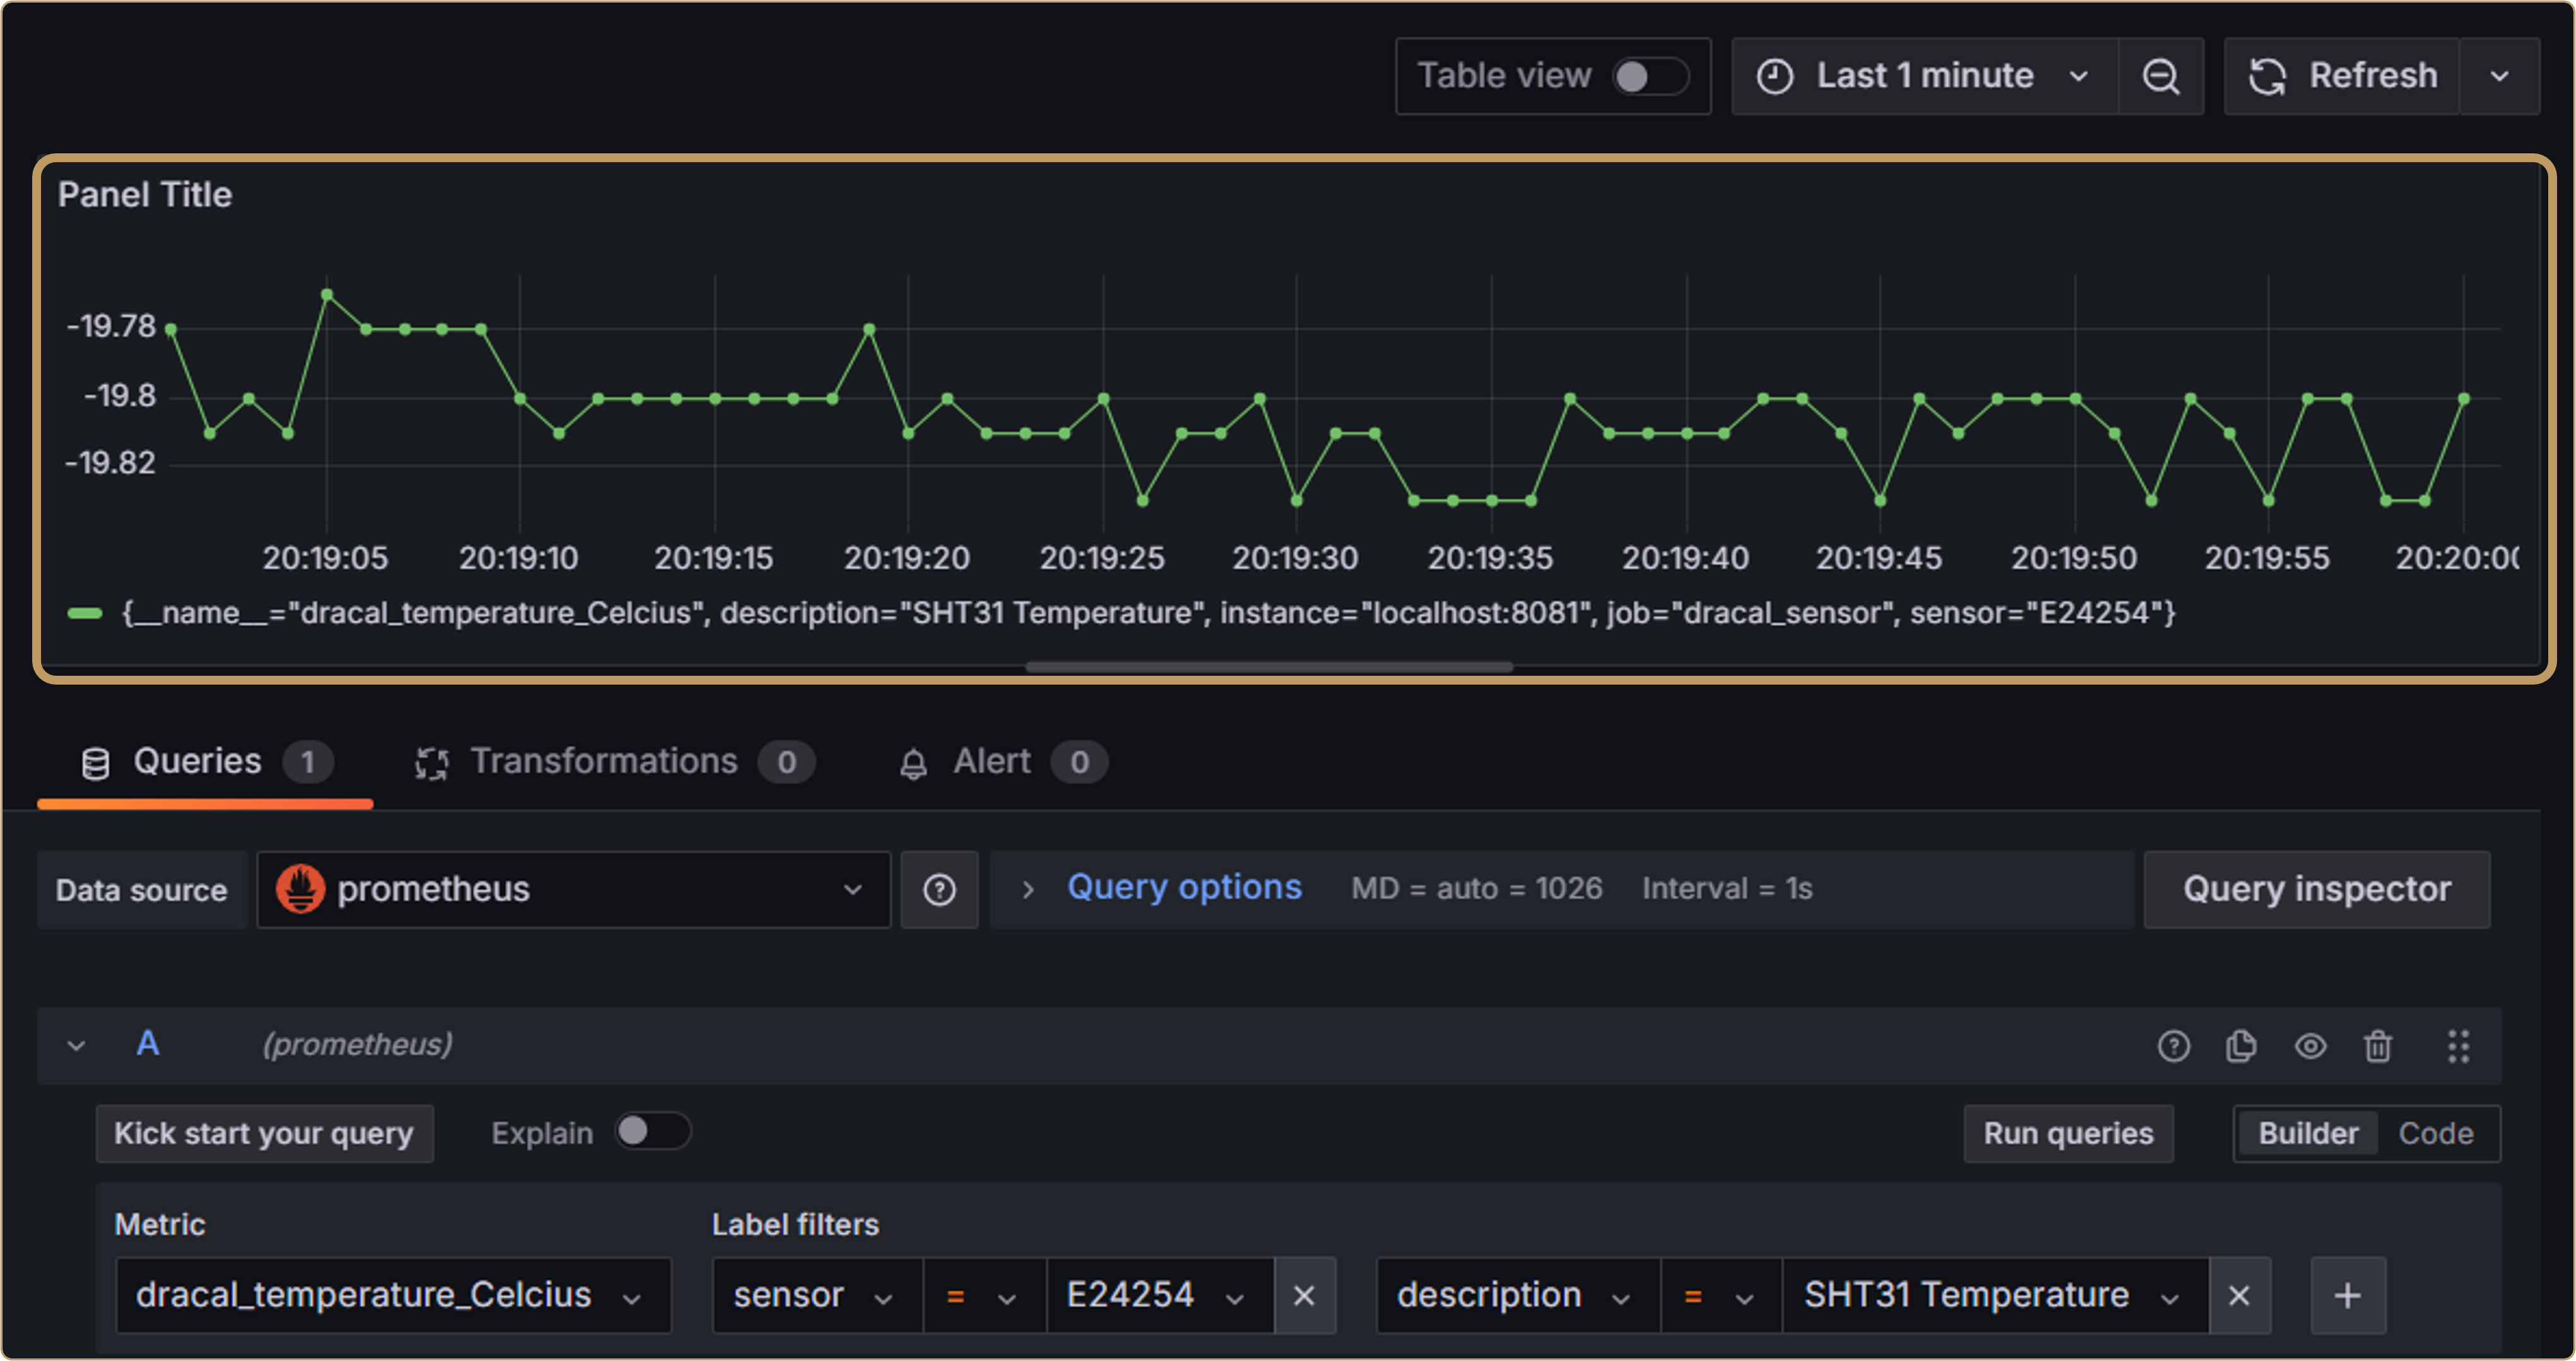
Select Prometheus as the data source. You will see a screen for configuring a new chart, as shown below, followed by explanations:
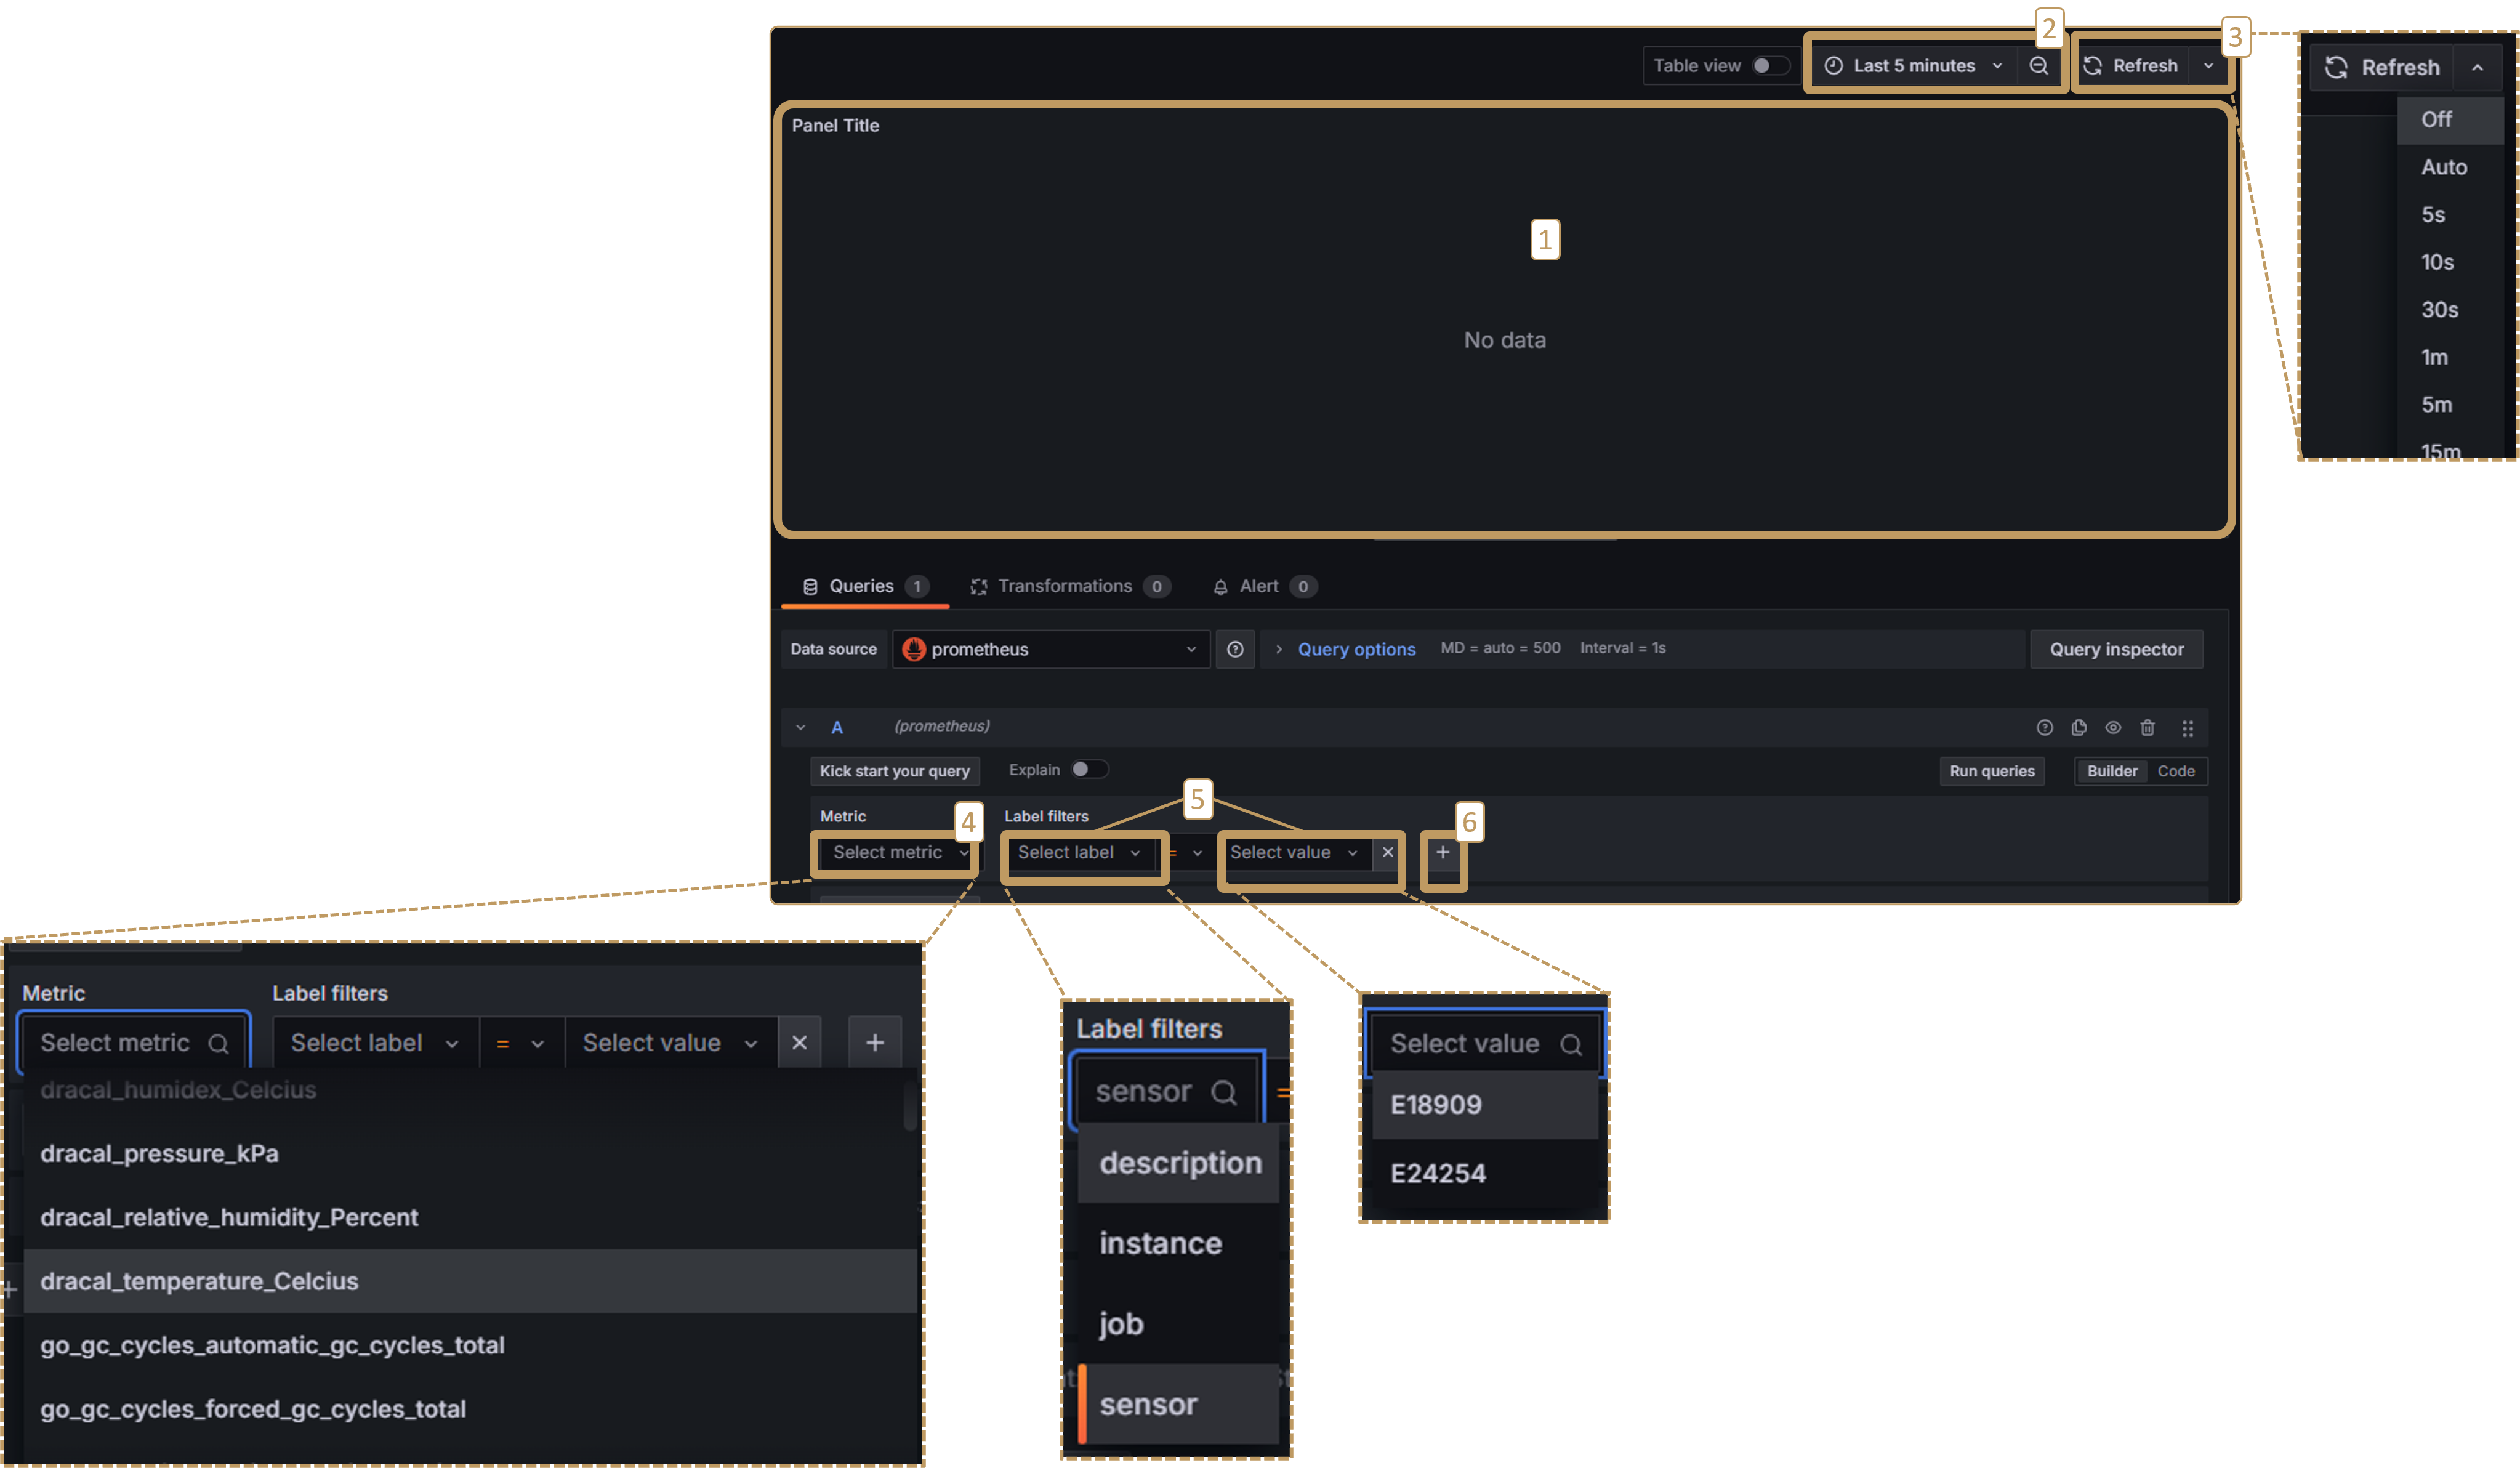
Explanations:
- Graph visualization
- Time range for the horizontal axis. Choose 5 minutes to see recent data.
- Refresh rate. Leave it “off” at first, then adjust to the desired frequency when the correct data is displayed. The minimum frequency is currently 5 seconds.
- Data to display. Select the sensor channel you are interested in from the pre-generated dropdown list. The format is always as follows: {dracal}_{data type}_{measurement unit}
- You can add labels to specify your data identification. For example, if you have multiple sensors, specify the one of interest by selecting “sensor” and the correct serial number.
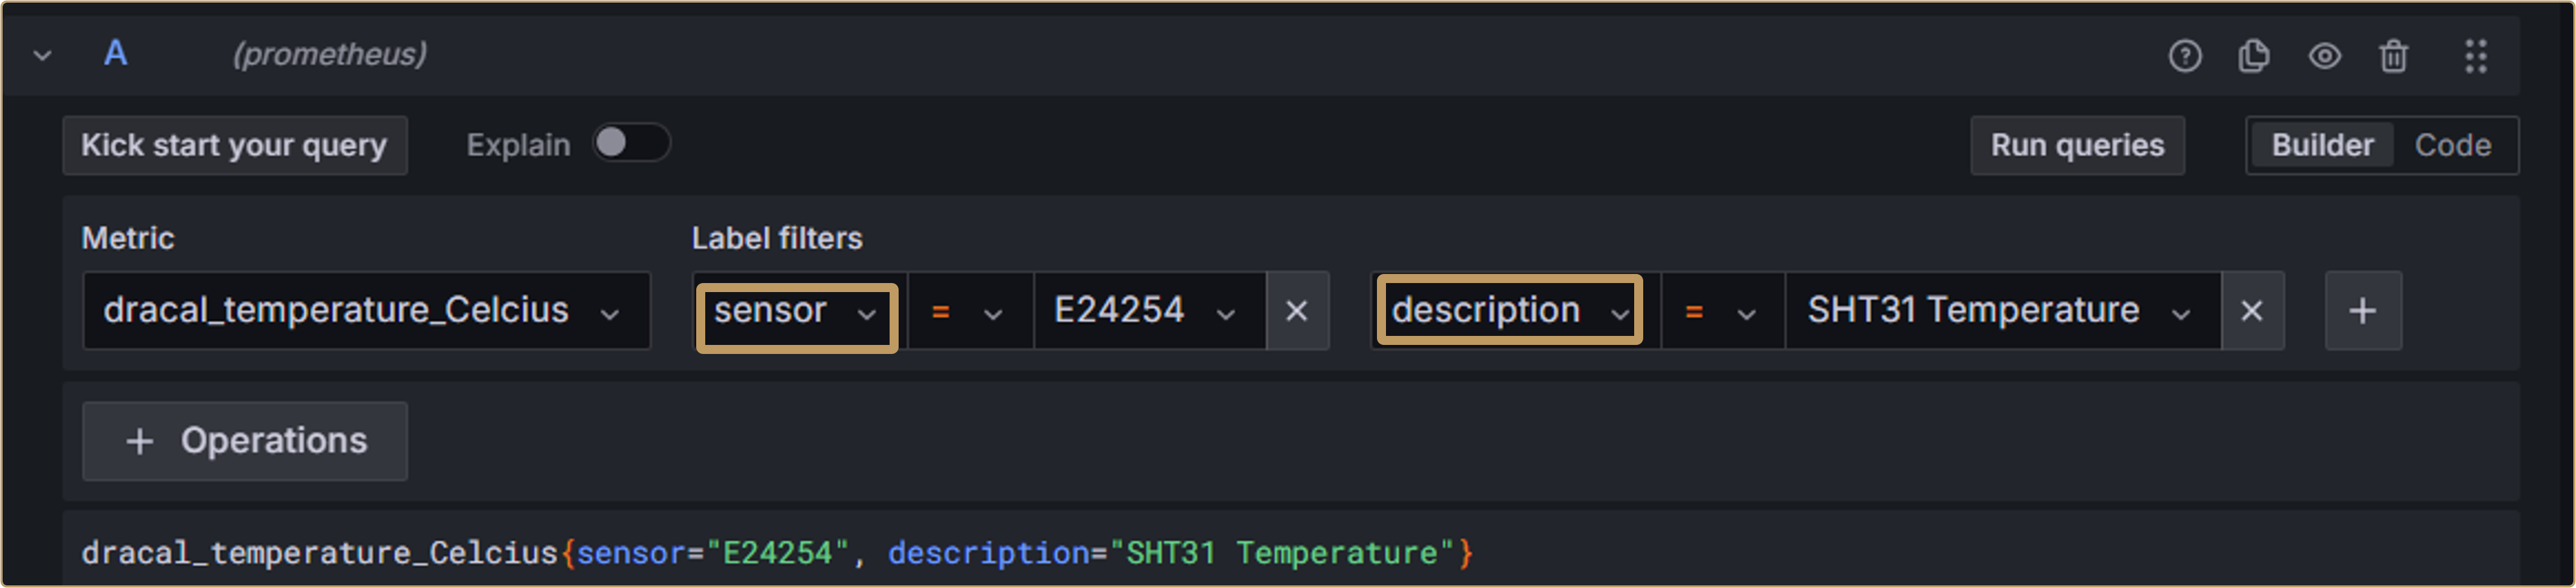
- Allows you to add additional labels to the same channel. For example, add a “description” label to specify your chosen channel. In the image below, the “sensor” and “description” labels are both used to identify the visualization:
When you’re done, click “Save dashboard” and then “Refresh”:
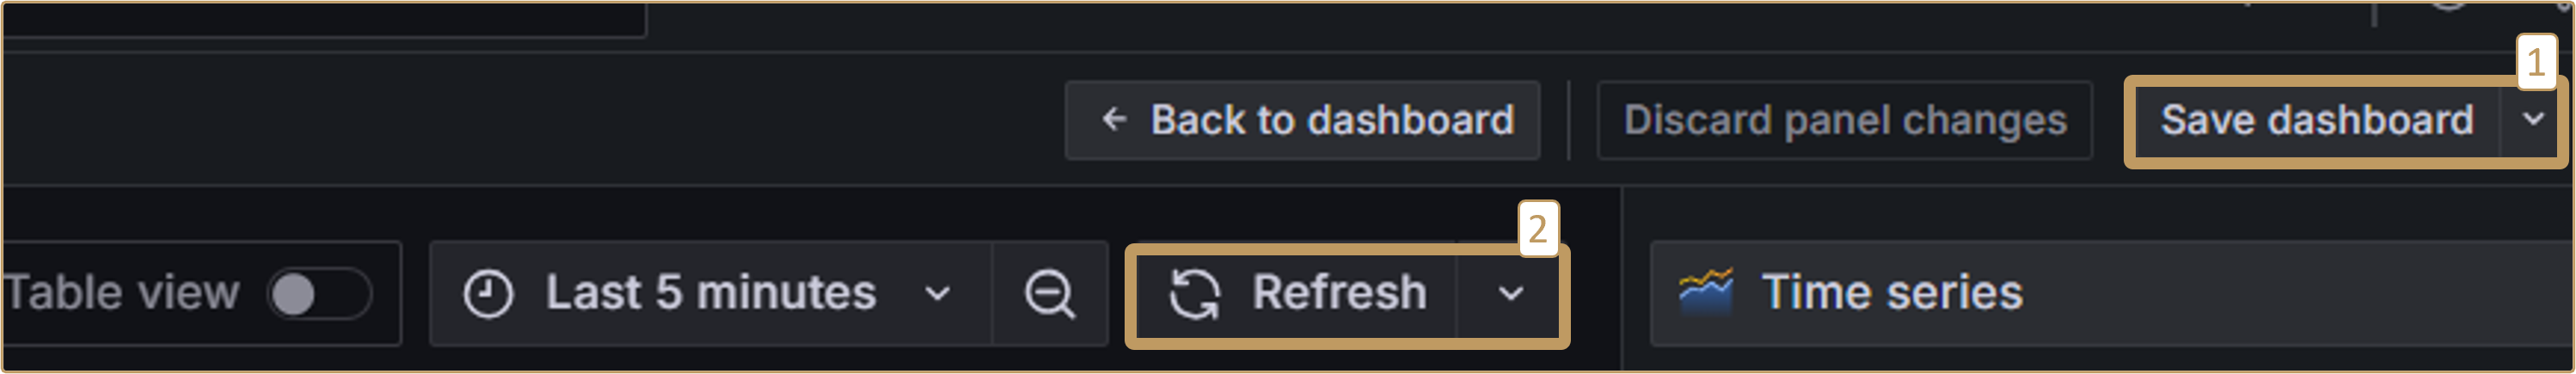
The graph should now be displayed:
3.3. Increasing the Refresh Rate (Optional)
If you followed step 2.1 of this guide, you can increase the refresh rate beyond the 5-second limit. However, some additional steps are required.
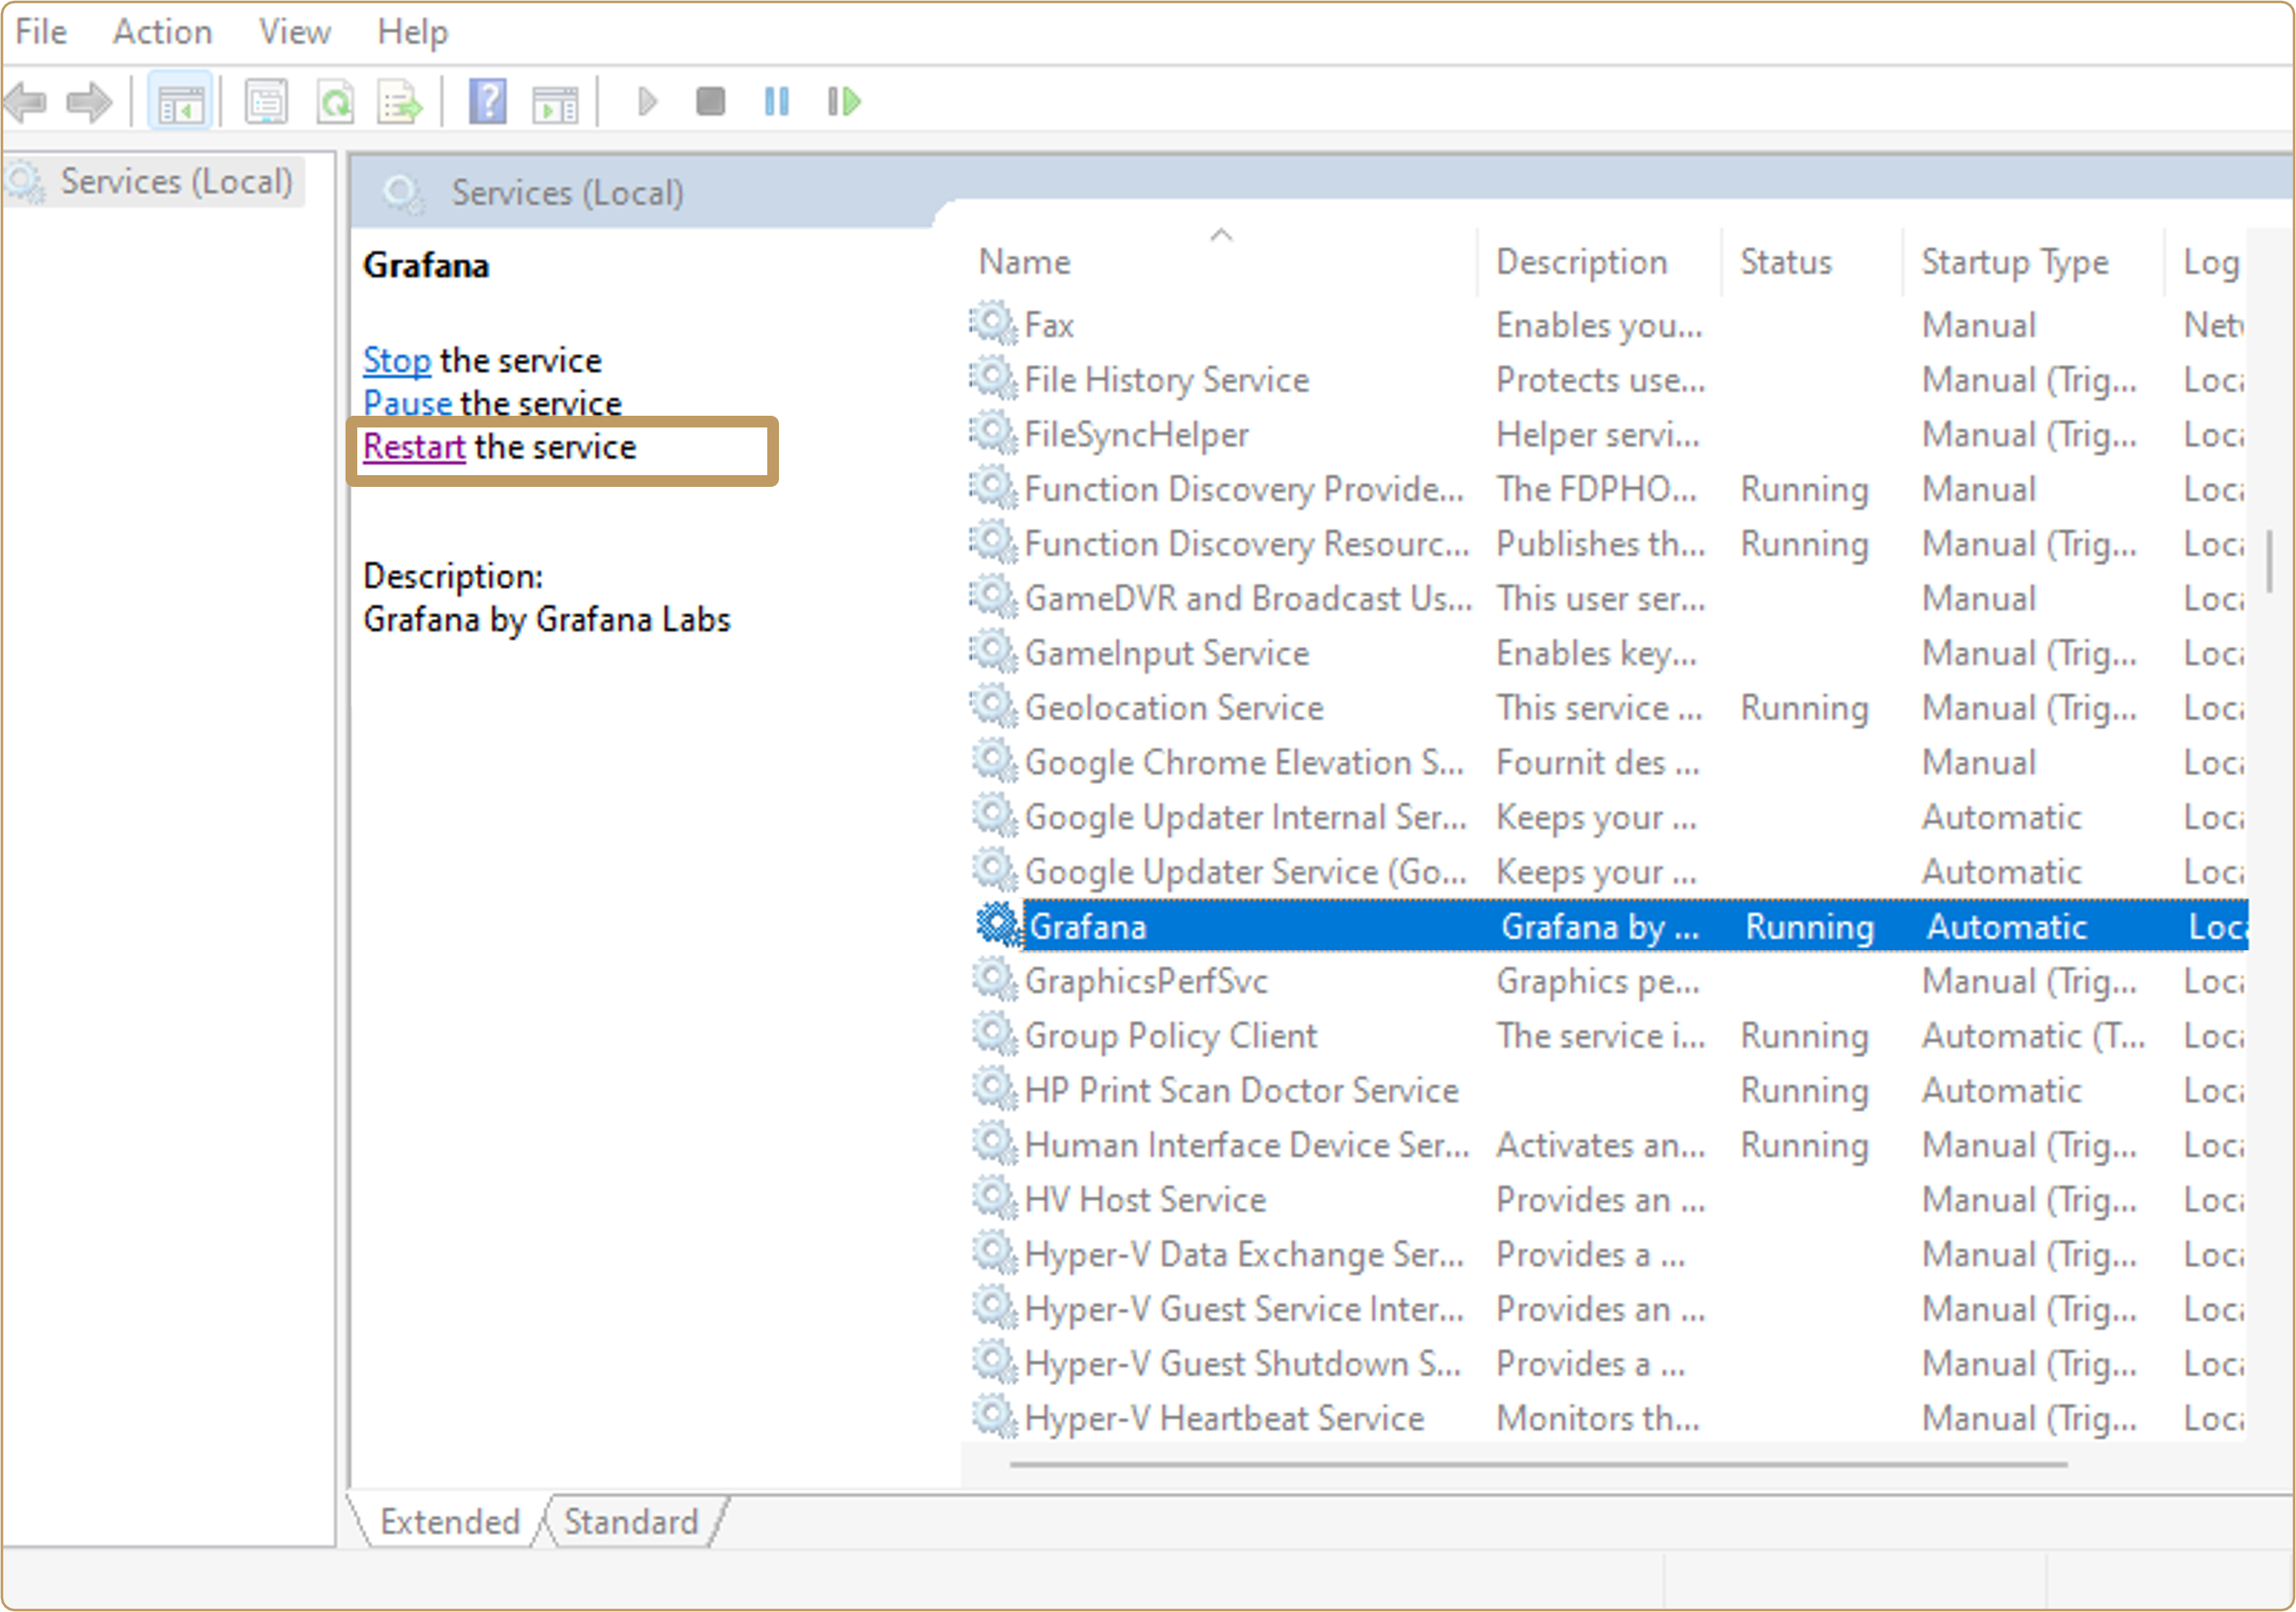
If you have shut down or restarted your computer since step 2.1, you can skip this step. Otherwise, open Windows Services by searching for “services” in the Windows search bar.
Find the “Grafana” service and restart it:
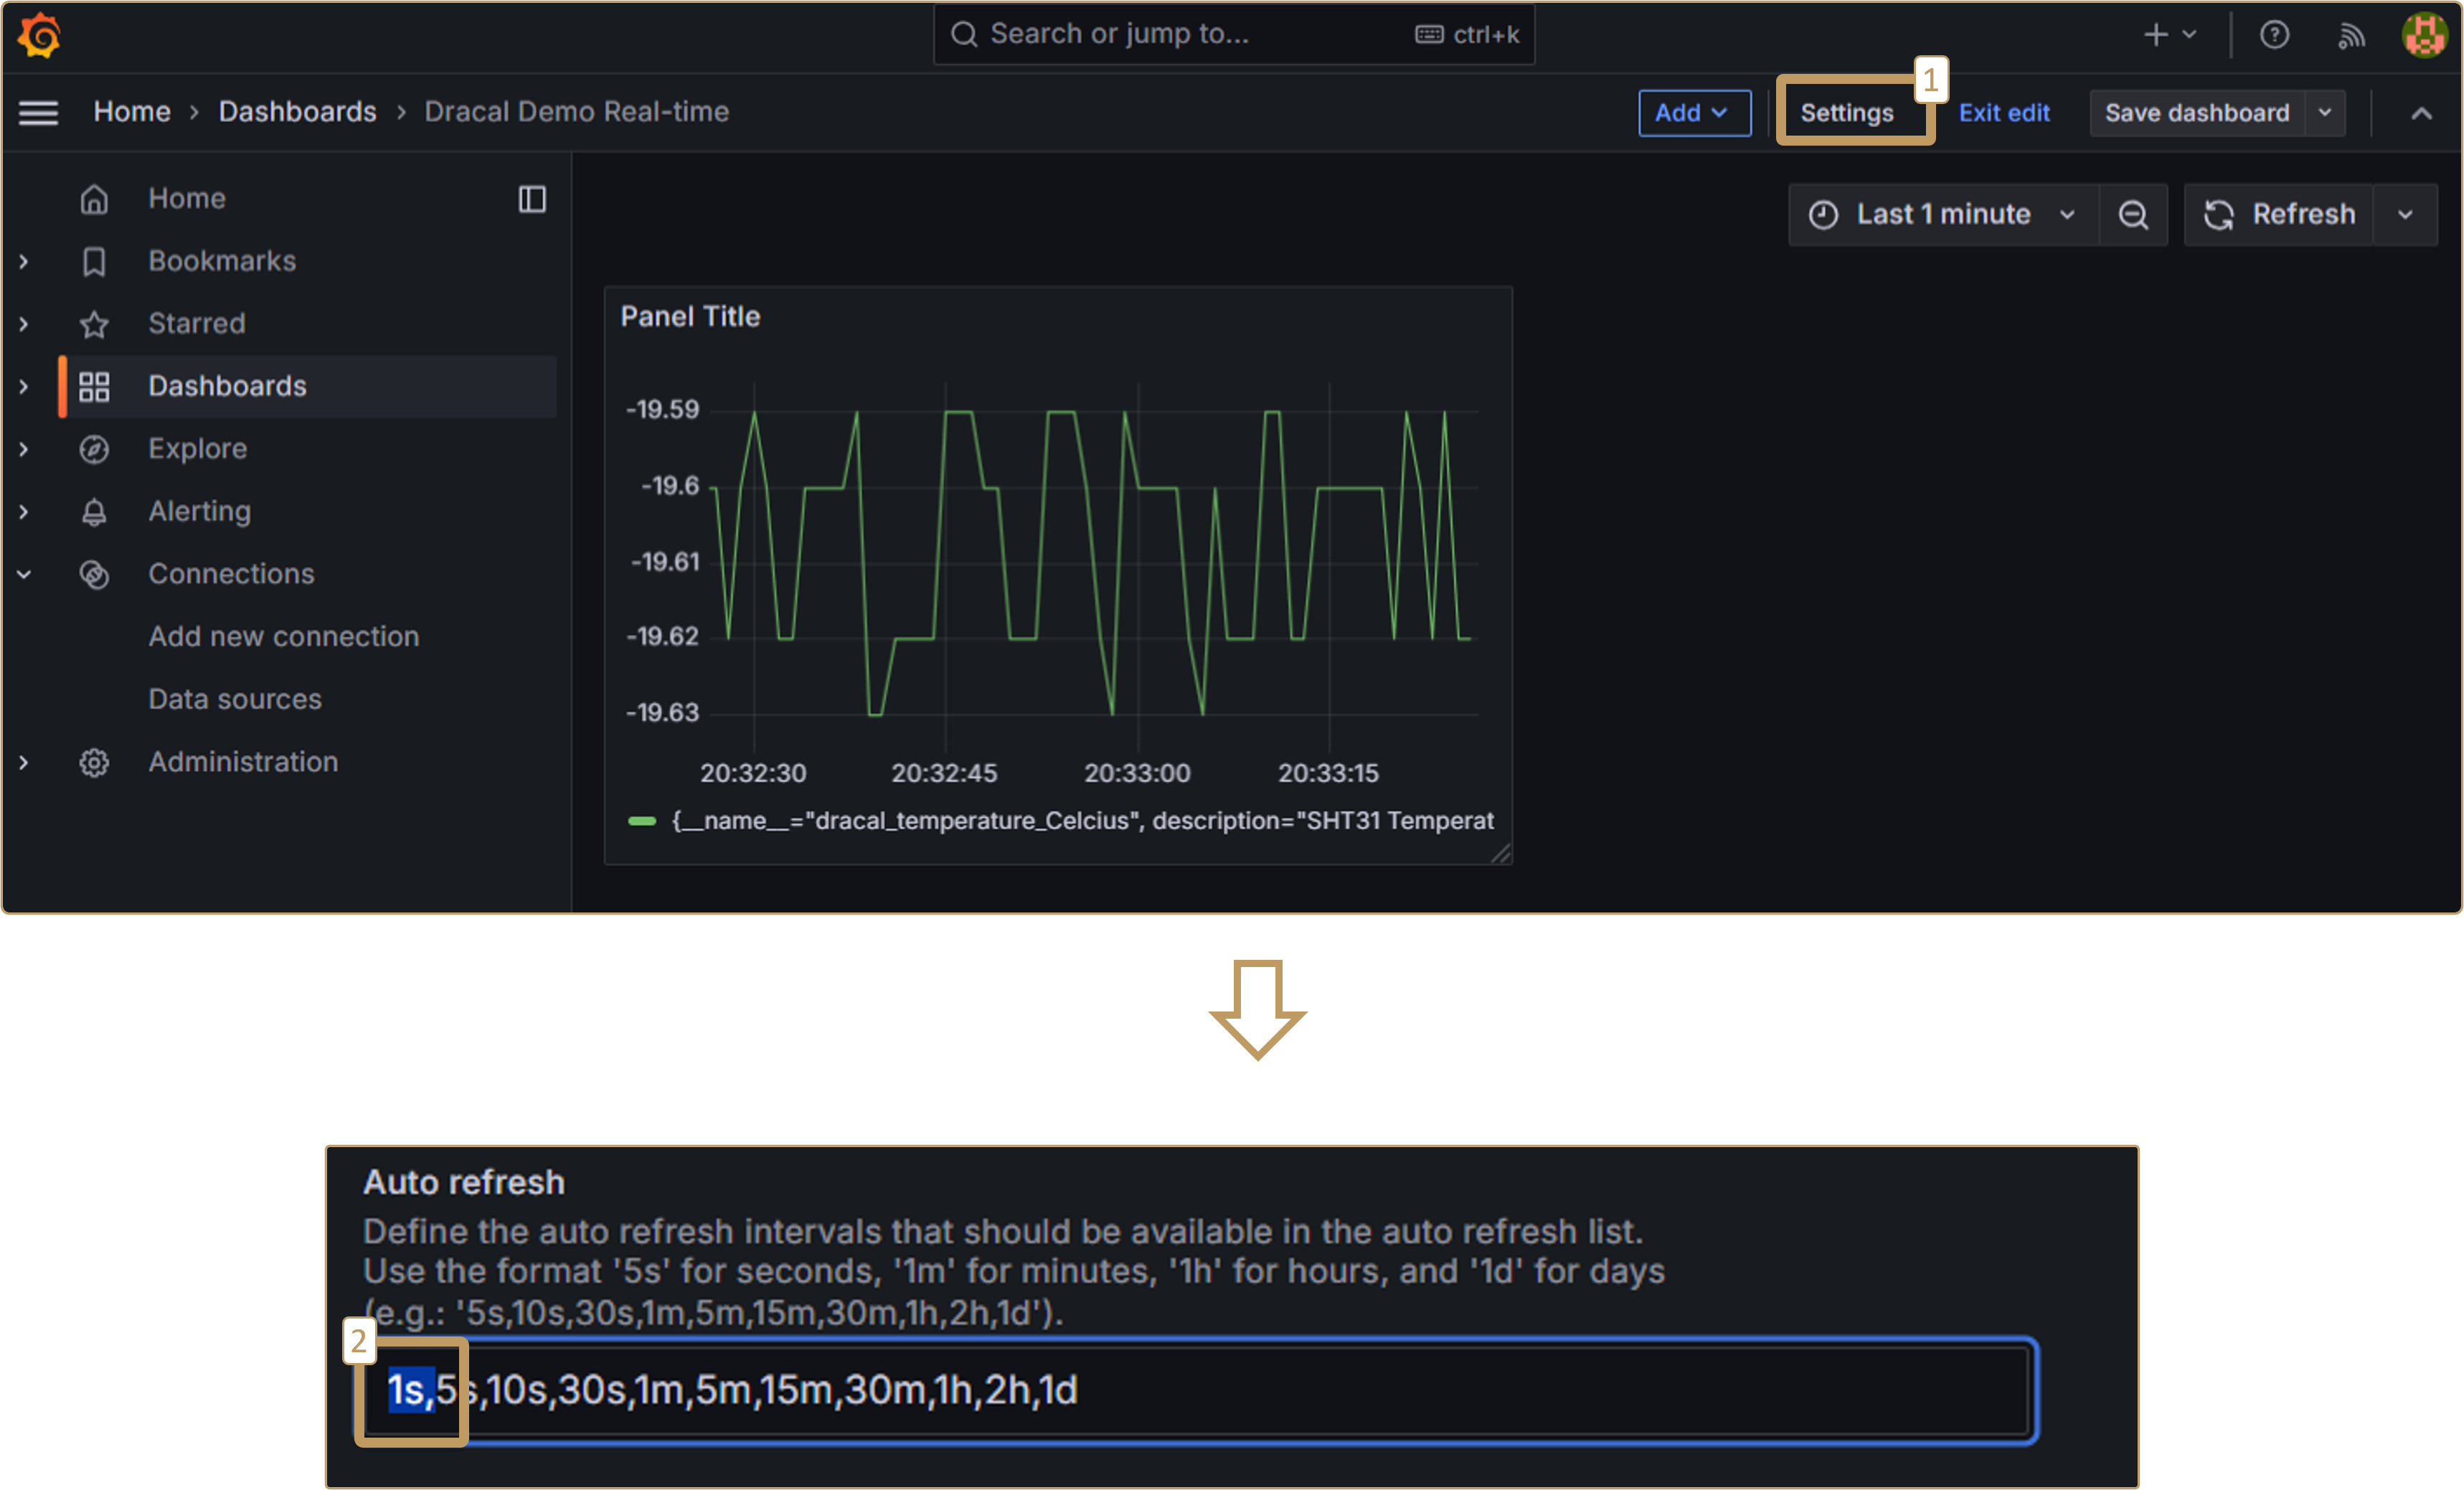
In the dashboard you created, open “Settings”. Find the refresh rate section and add the desired durations. Below, for example, a 1-second frequency is added to the available options:
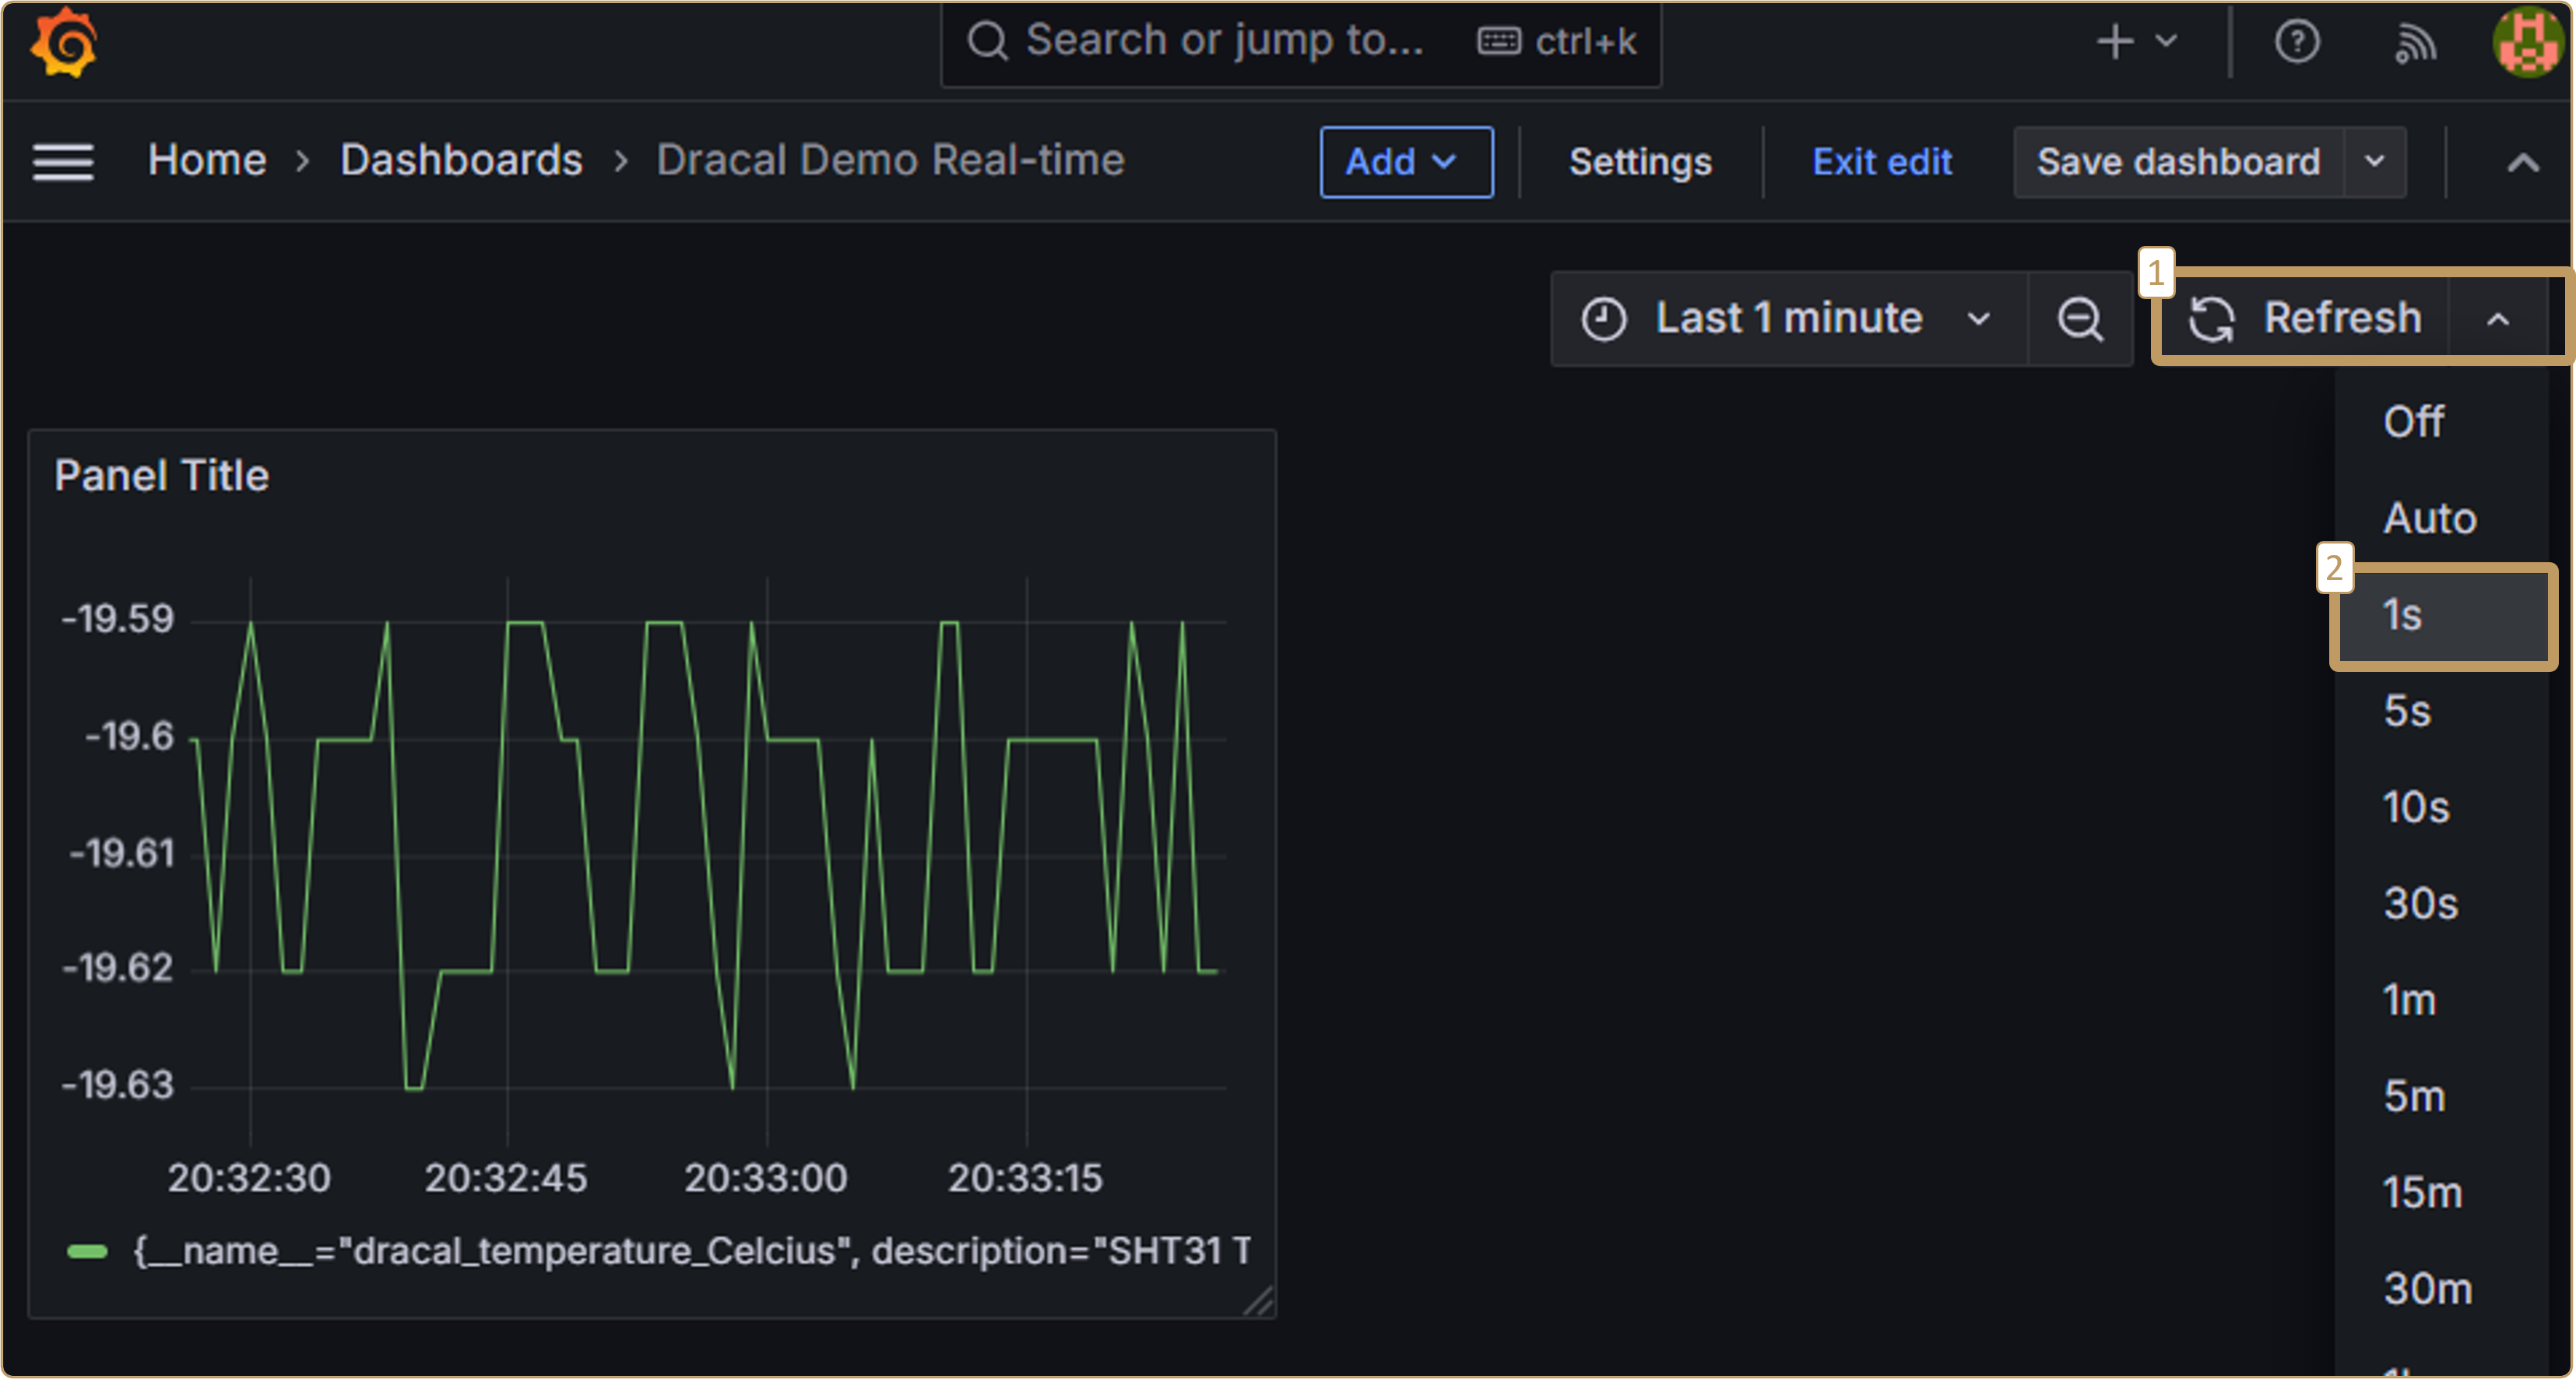
You can now select a 1-second refresh rate:
4. Next steps
You now know how to use Grafana to visualize Dracal sensor data. We invite you to consult step 3.3 of our tutorial on using Dracal data in Grafana from a log file to see how to duplicate a visualization. For further exploration, please consult the Grafana documentation.
Conclusion
Using the DracalMetricsExporter tool we created for you, you can quickly set up dashboards to visualize different channels from multiple Dracal sensors in real time across several distinct graphs. We hope this illustrated tutorial has helped you quickly move forward with your data acquisition and visualization project.
PRODUCTS YOU CAN TRUST
Approved by engineers, scientists and researchers around the world.
Thousands of companies trust our products worldwide:


Get reliable and ready-to-use precision measurements with Dracal
Always offered with our products!
EASY TO USE IN YOUR OWN APPLICATION
- Ready-to-use, accurate and robust real-time data flow
- Choose the interface that works best for you (CLI, virtual COM, REST API)
- Code samples available in 10+ programming languages (Python, C/C++, C#, Java, Node, .Net, etc.)
- Operates under Windows, Mac OS X and Linux
- Usable with LabView (CLI guide, Virtual COM guide)
- All tools packaged within one simple, free of charge, DracalView download
FREE DATA VISUALIZATION, LOGGING AND CALIBRATION SOFTWARE
- Get up-and-running in less than 3 minutes
- Operates under Windows, Mac OS X and Linux
- Real-time on-screen graphing and logging
- Log interval down to 0.5 second and configurable units (°C, °F, K…)
- Simultaneous use of unlimited Dracal sensors supported
- Simple user-calibration (products with the -CAL option)
- Connectivity with SensGate Wi-Fi/Ethernet gateway
Not sure if your project will benefit from Dracal’s solution?
Contact us, tell us about your project, and we’ll quickly determine if there’s a fit.
"*" indicates required fields