Data visualization in Grafana from a log file
This guide explains how to view a data logging file in Grafana using the format generated by Dracal tools. Thanks to its standard structure, this format can also be easily adapted to other similar log files. Through a detailed, illustrated tutorial, we’ll take you step-by-step through the creation of visualizations of data from your USB Dracal sensors using Grafana, a flexible, free tool dedicated to data visualization. For more automated, real-time visualization, stay tuned. A new tutorial is coming soon!
1. Create a data logging CSV file for your Dracal USB measuring instruments
There are two ways to generate data logging files with Dracal’s (all free!) tools. The first is to use the “Logging” tab in the DracalView graphical tool. You will find here an overview of the features available in this tab, and here a short video showing you how to use it in real time. If you choose this option, please select the .csv format so that you can use this tutorial as is.
The other way to generate a .csv log file for your Dracal USB sensors is to use the command-line tool dracal-usb-get.
If you’d like a quick start with Dracal’s command-line tools, check out this guide. Documentation for dracal-usb-get can be found here.
As a quick example, the command dracal-usb-get -i a -L C:\Users\Public\Documents\test.csv can be used to record all channels of the first sensor detected. Stop recording when enough data has been collected.
2. Download Grafana
Grafana has a free version that runs on a computer, and a paid version that runs on the Internet. The paid version is not necessary in this case.
Download the free version of Grafana (OSS, Open-source software). Follow the installation instructions for your operating system.
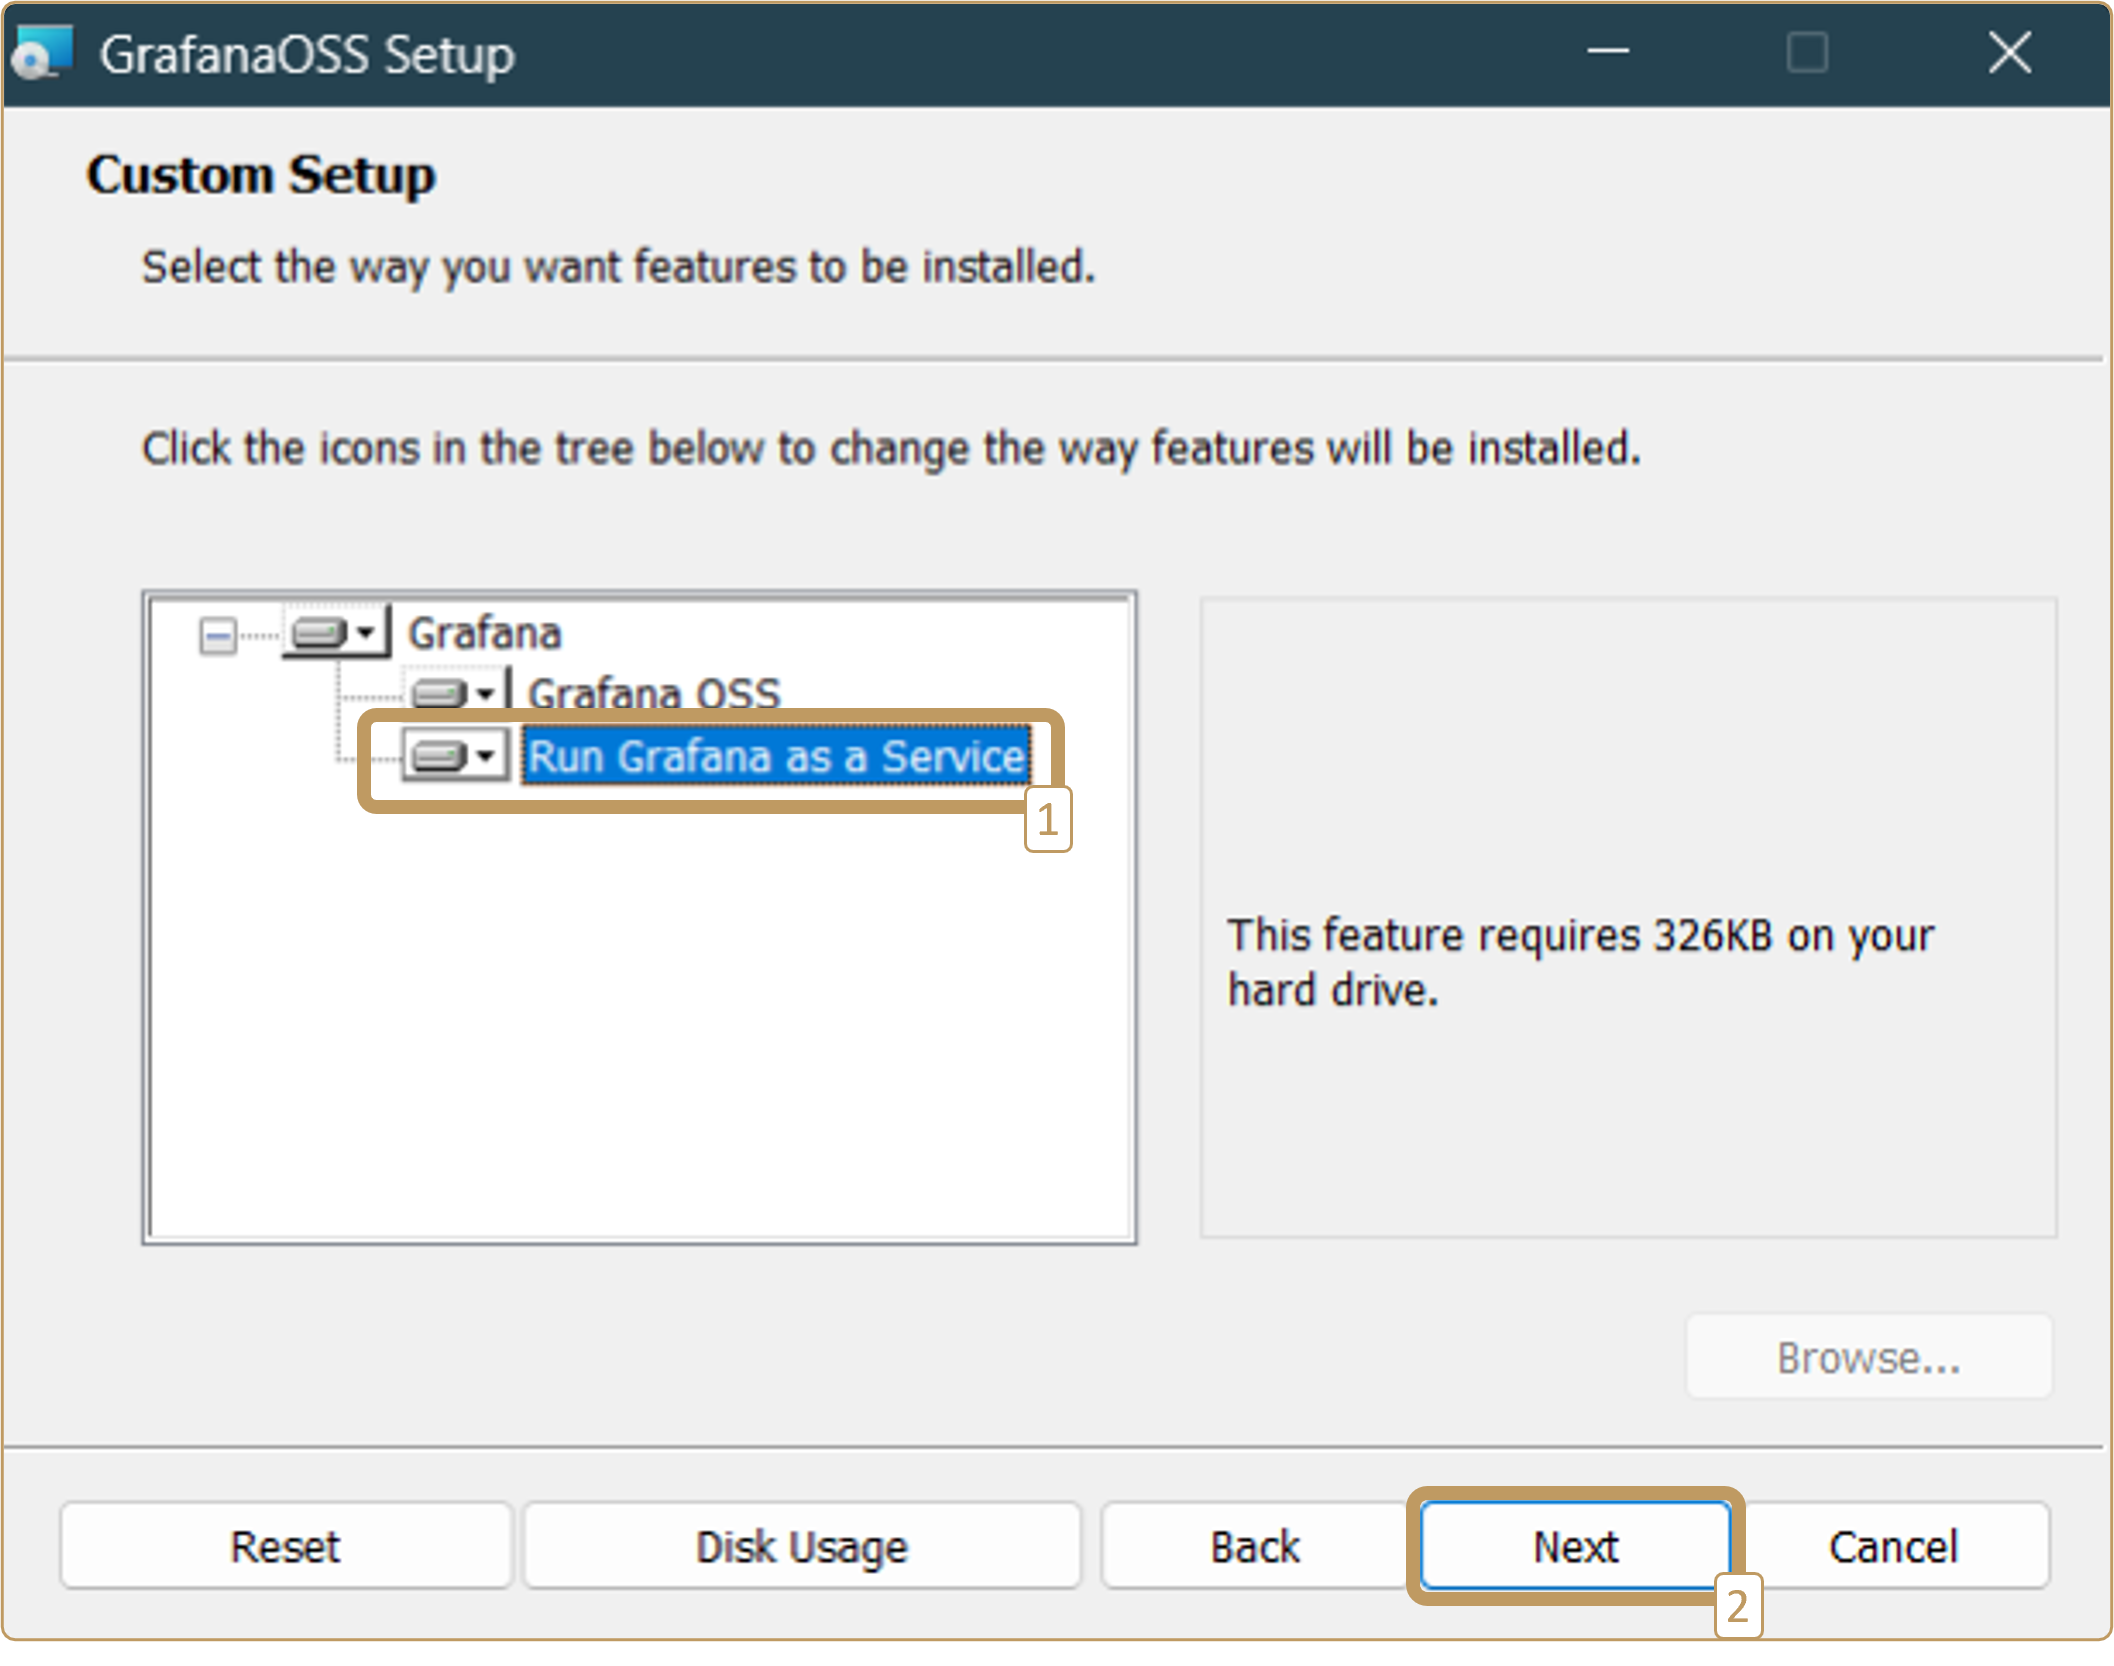
If you’re using Windows, we suggest you install the “Run Grafana as a Service” component in the “Custom Setup” step, which enables Grafana to be started automatically:
3. Using data in Grafana
Grafana on your web browser at http://localhost:3000/. Log in with the default user name “admin” and the default password “admin”.
3.1 Connecting Grafana to data
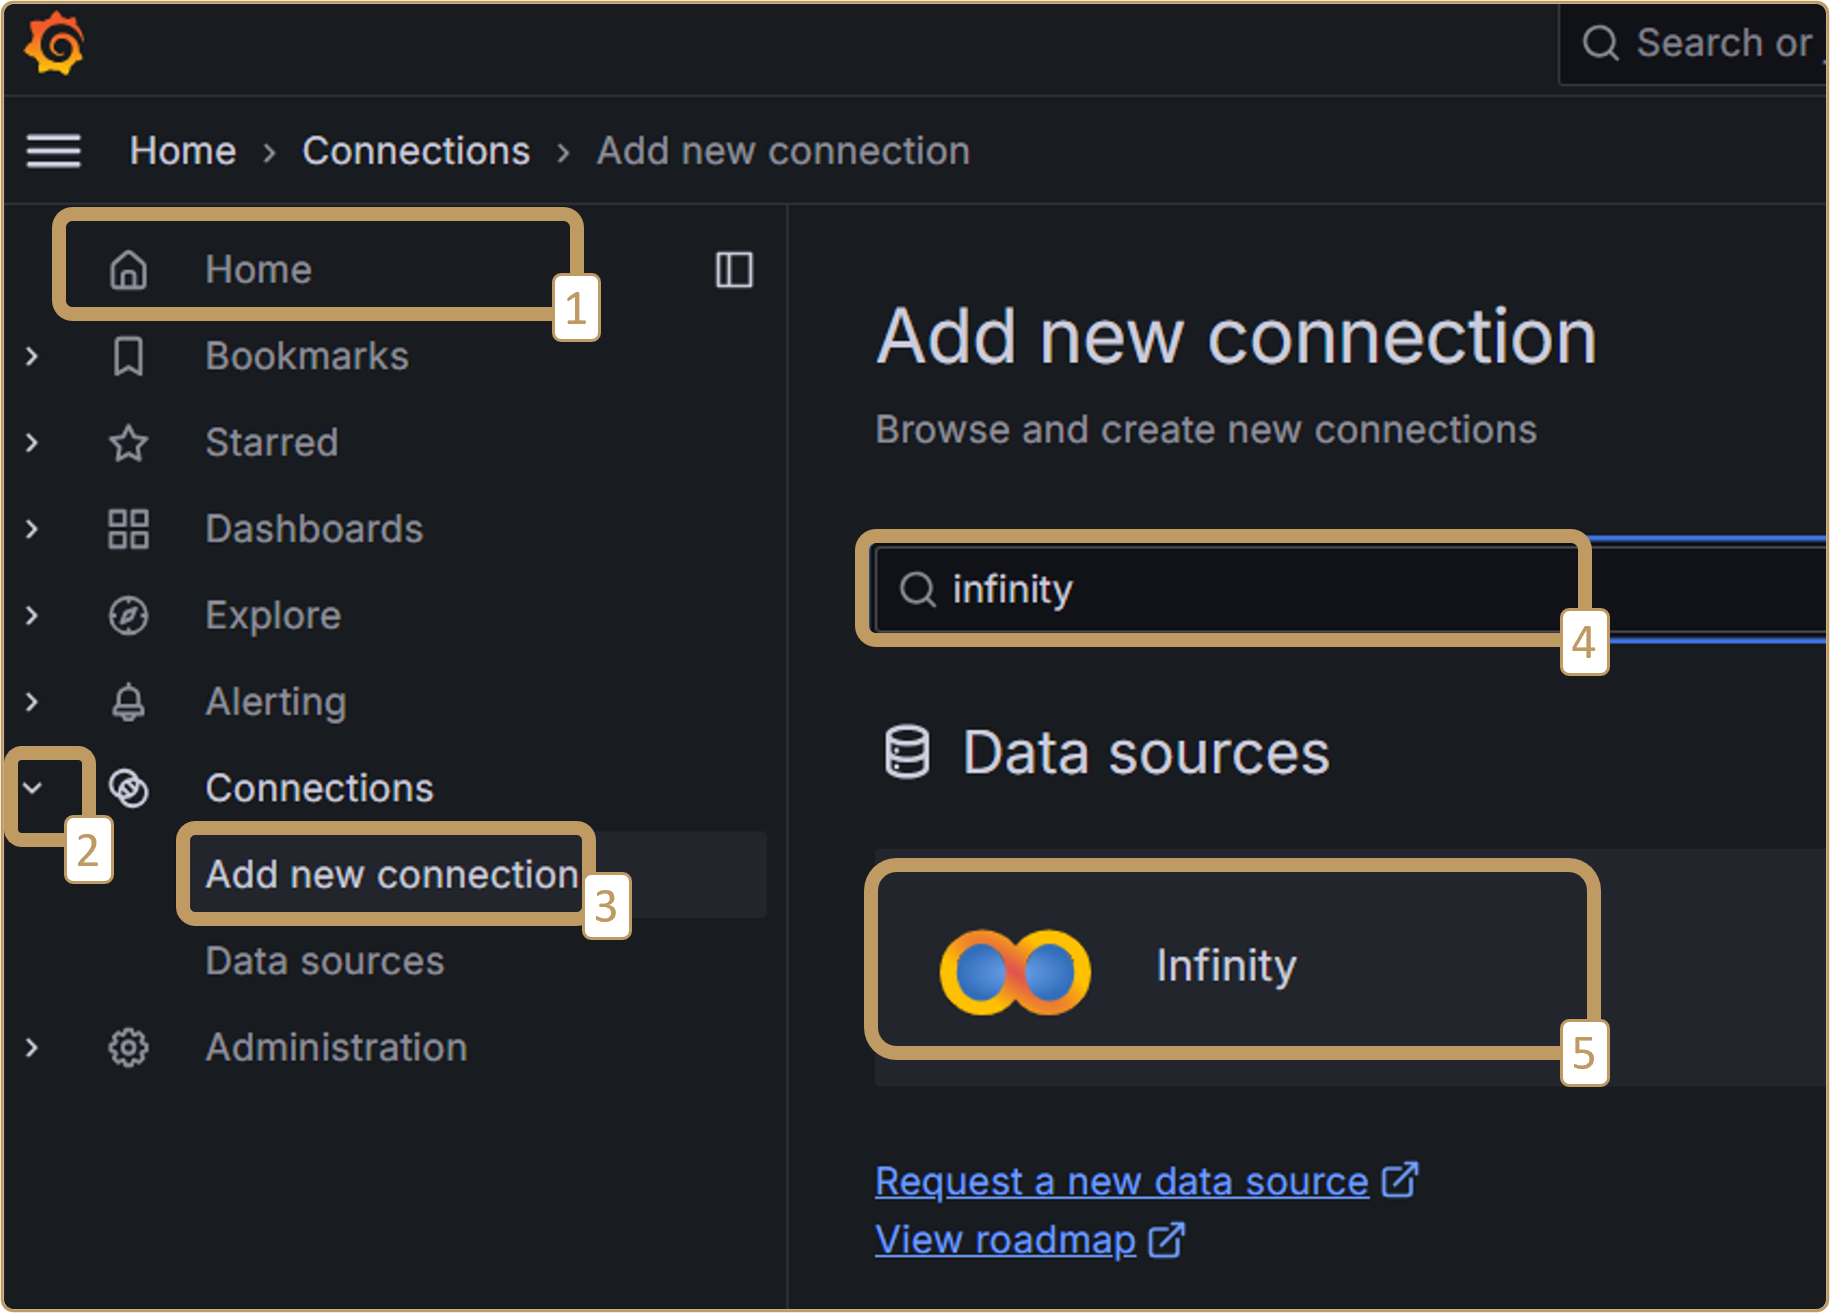
In the left-hand navigation bar, click on “Connections” -> “Add new connection”. Search for and select “infinity”:
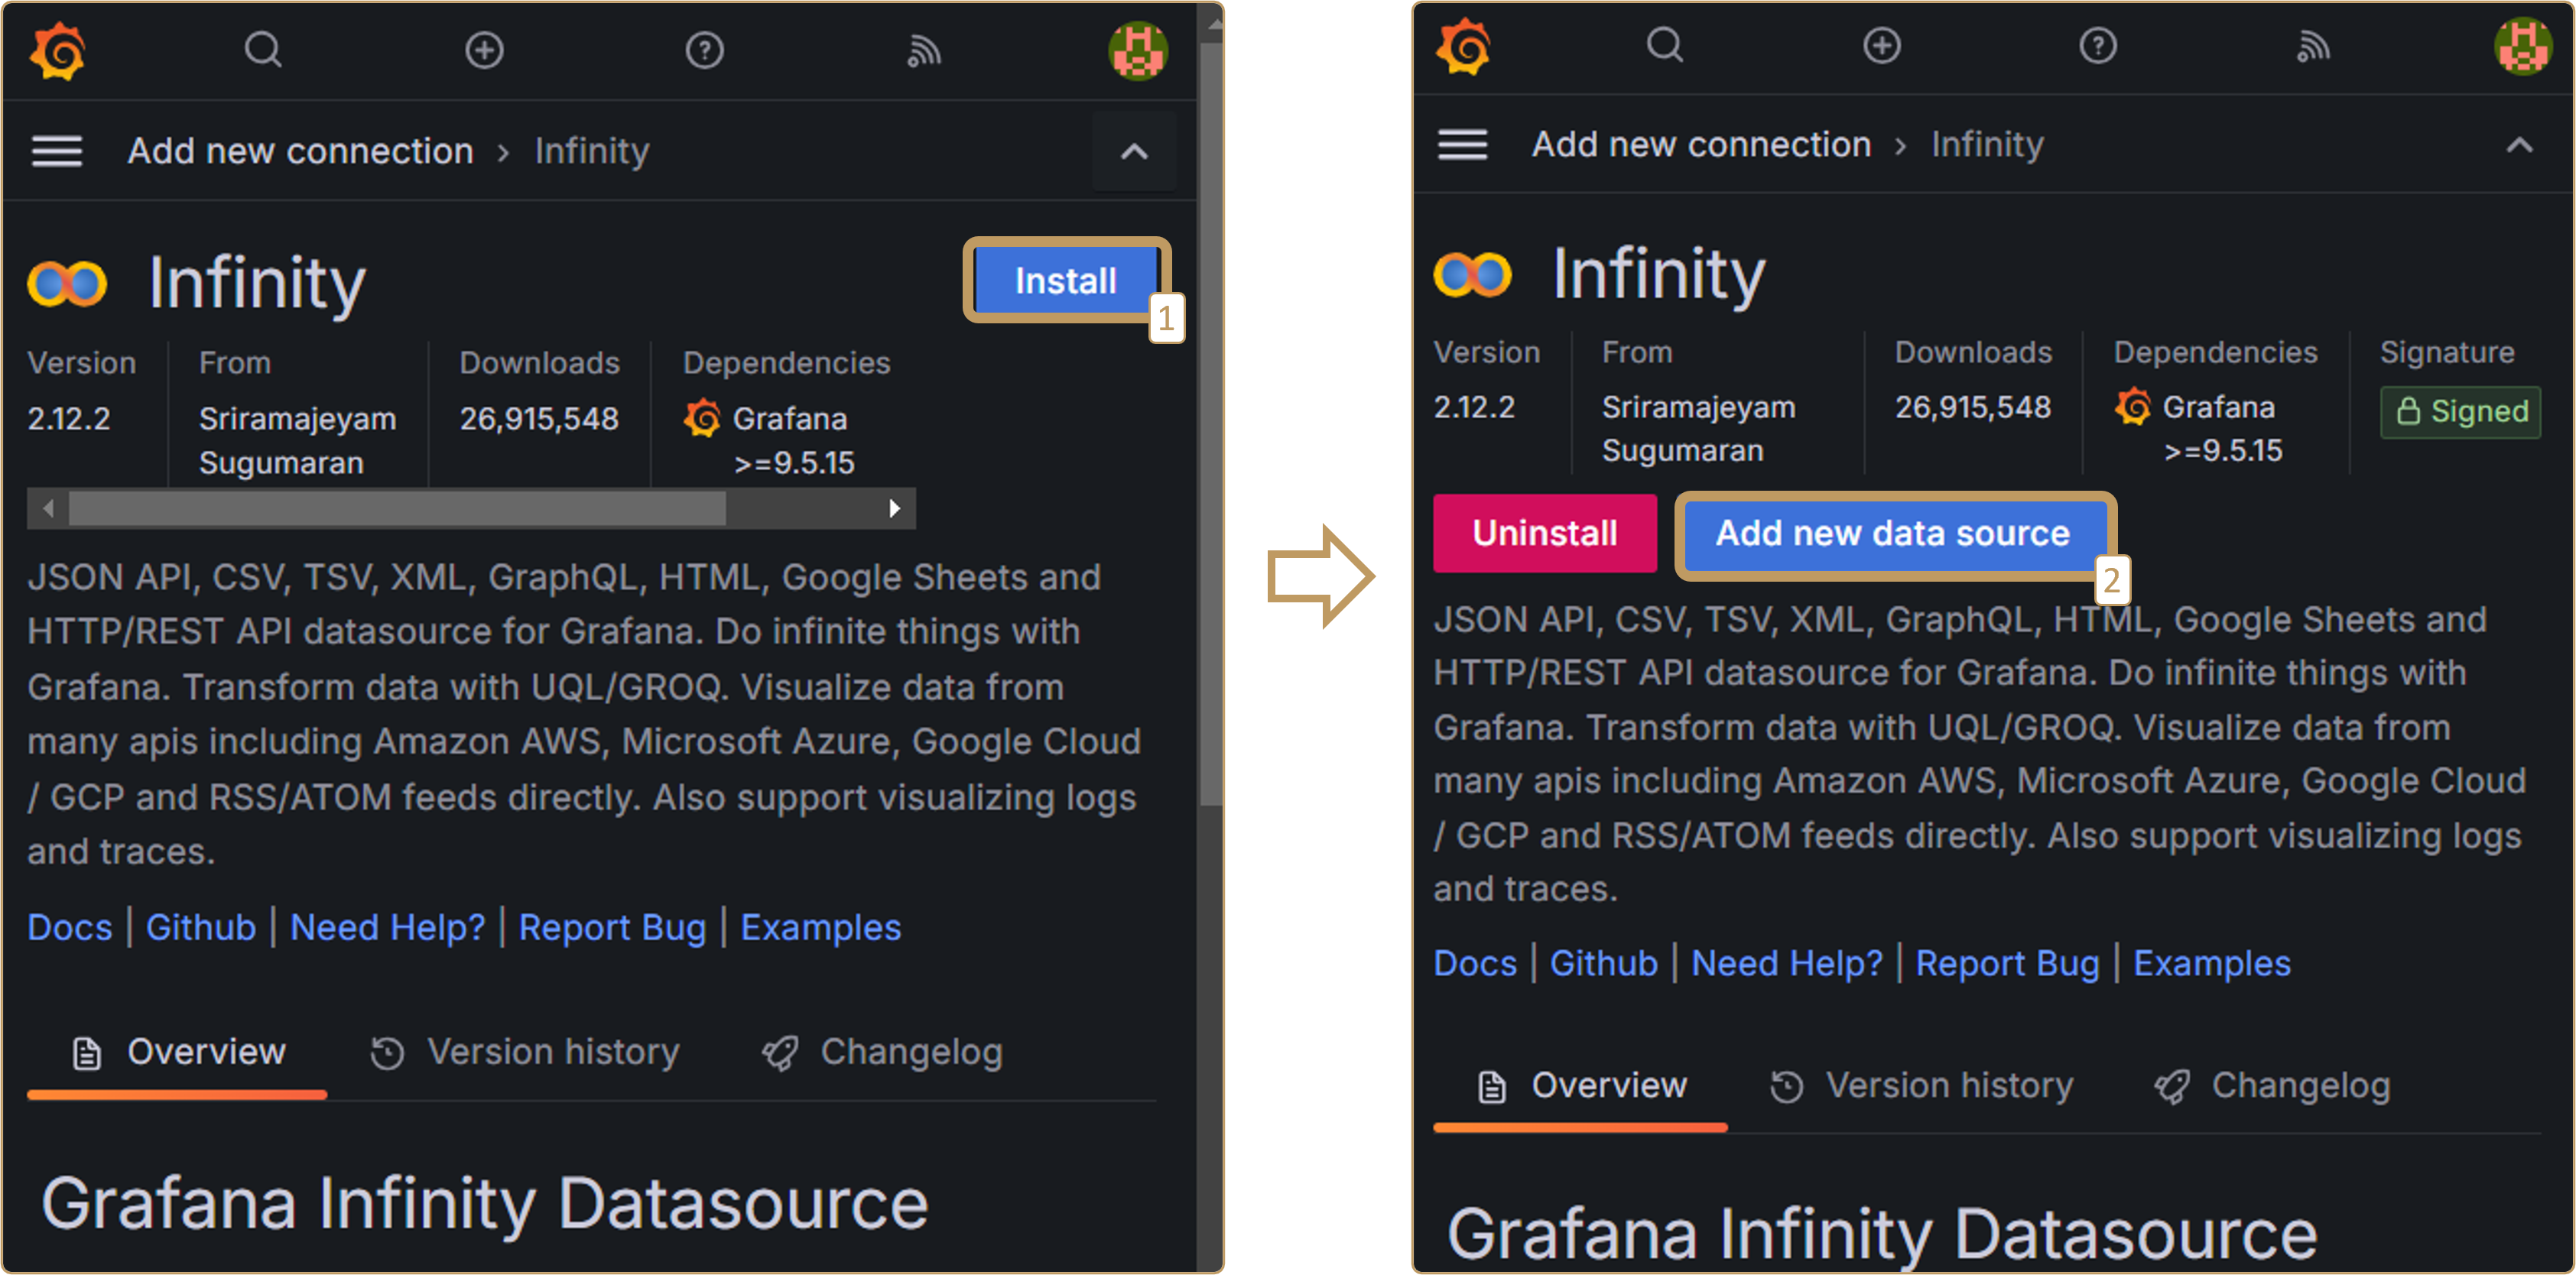
Install the extension and add it as a data source:
3.2 Creating a dashboard
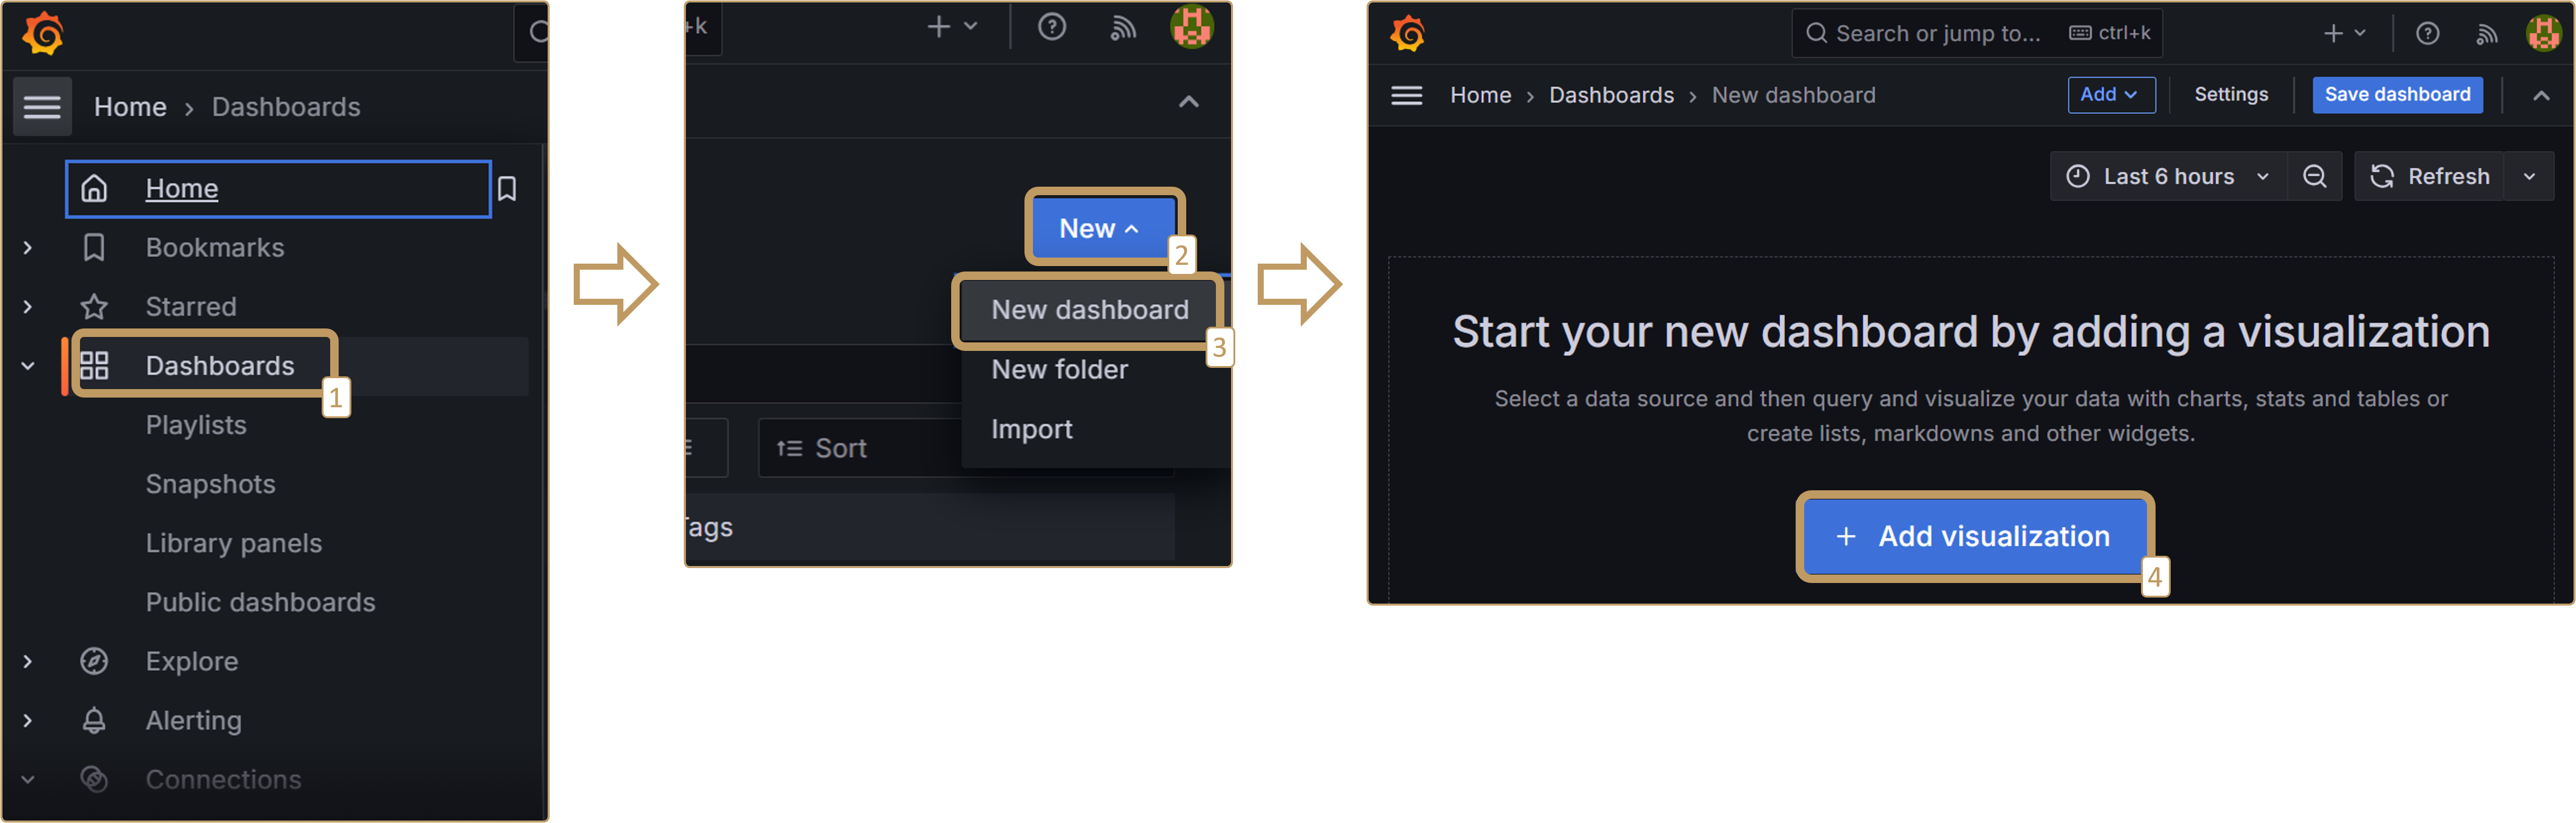
In the left-hand navigation bar, click on “Dashboard” -> “New” (blue button at top right) -> “New dashboard” -> “Add visualization”:
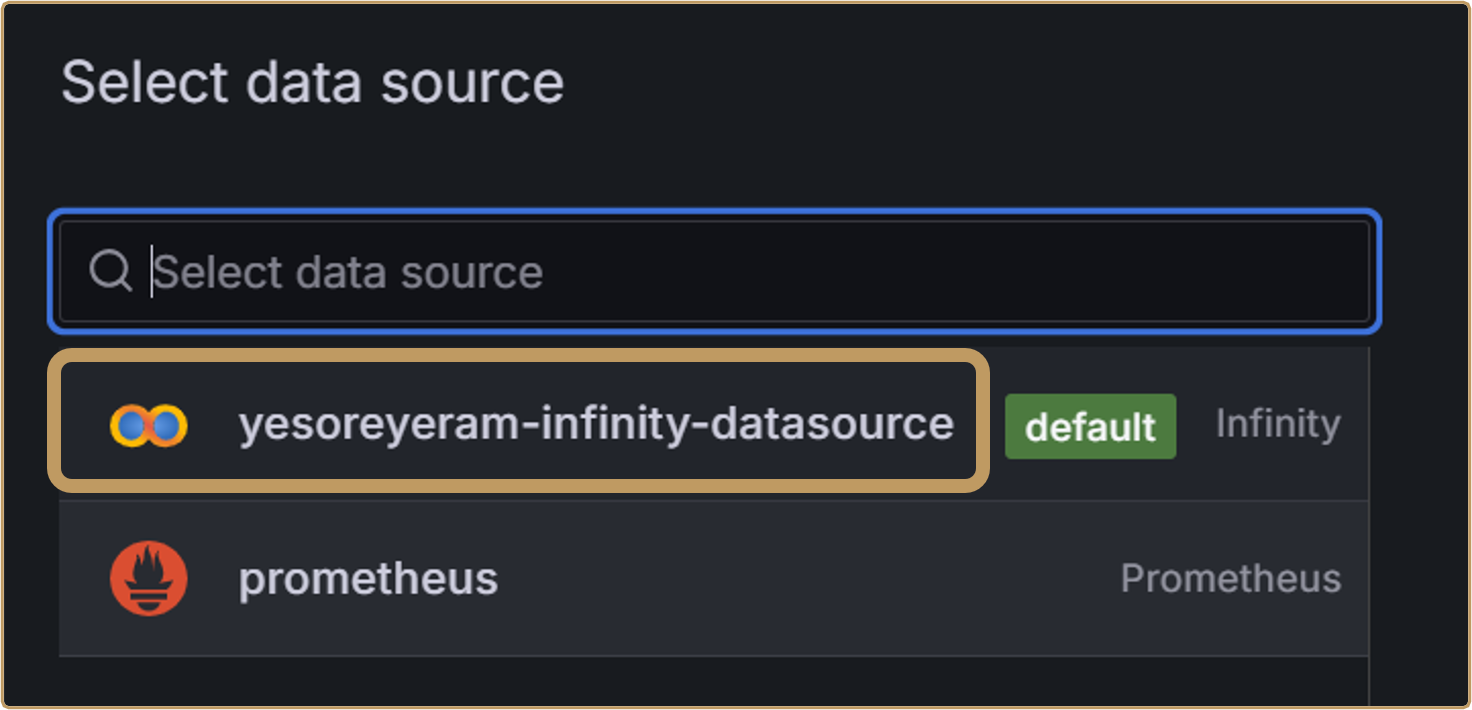
Choose Infinity (yesoreyeram-infinity-datasource) as your data source. You’ll see the screen for configuring a new graph.
You’ll see the screen that allows you to configure a new graph, with the following choices to be made under “Queries”:
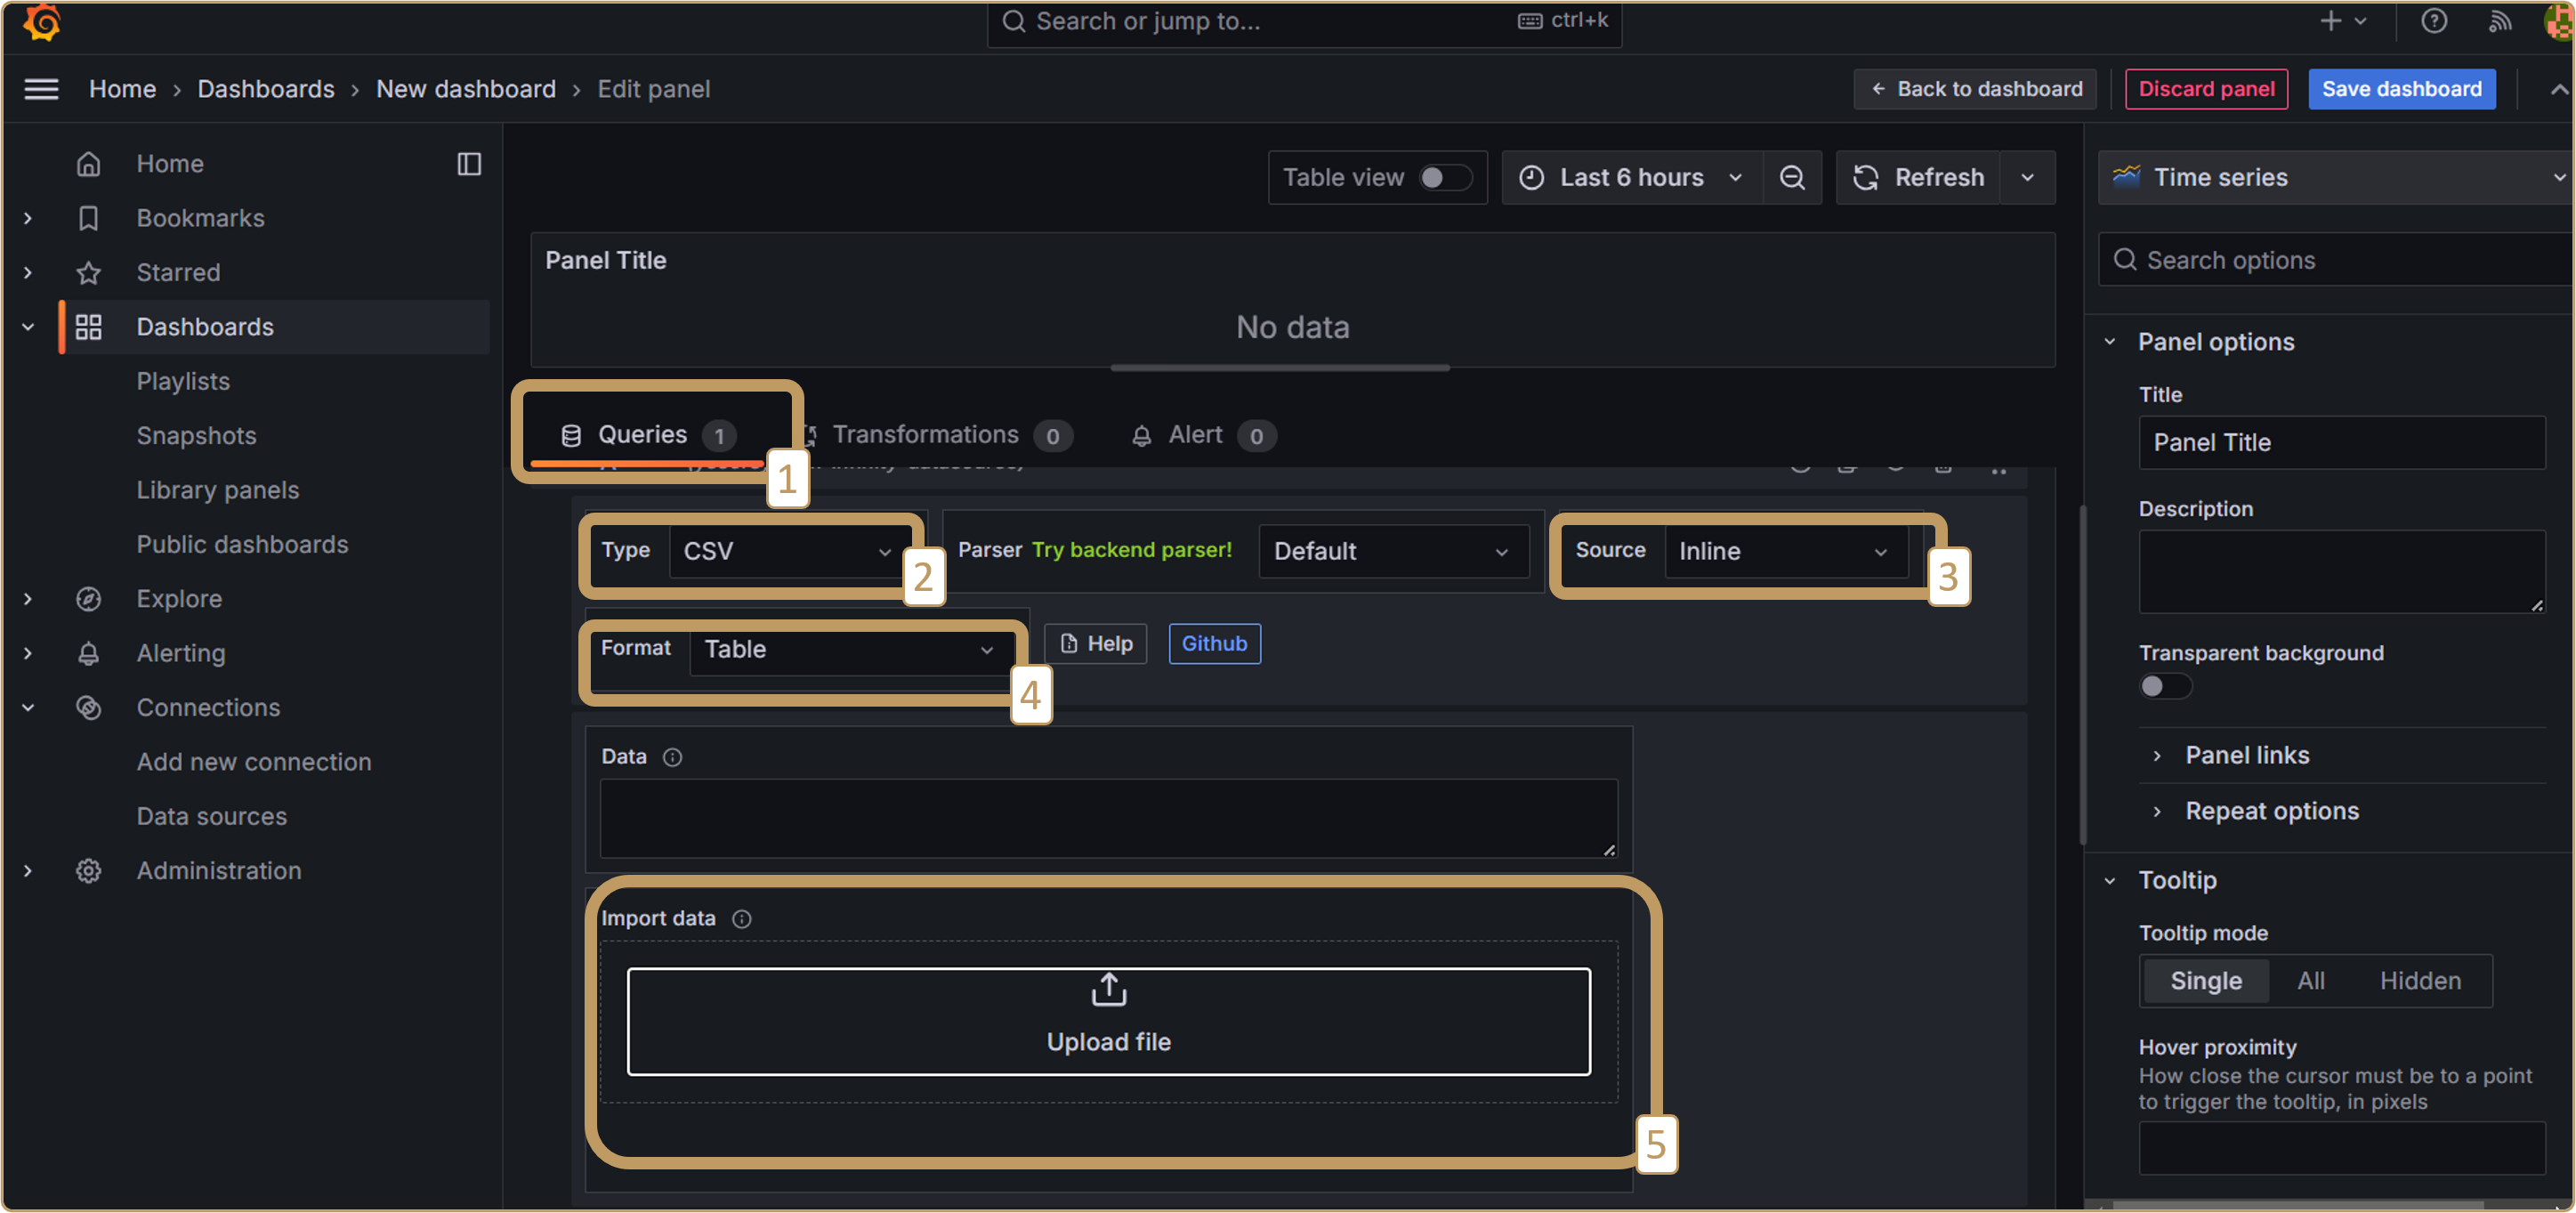
Upload your CSV file to location [5] in the image above.
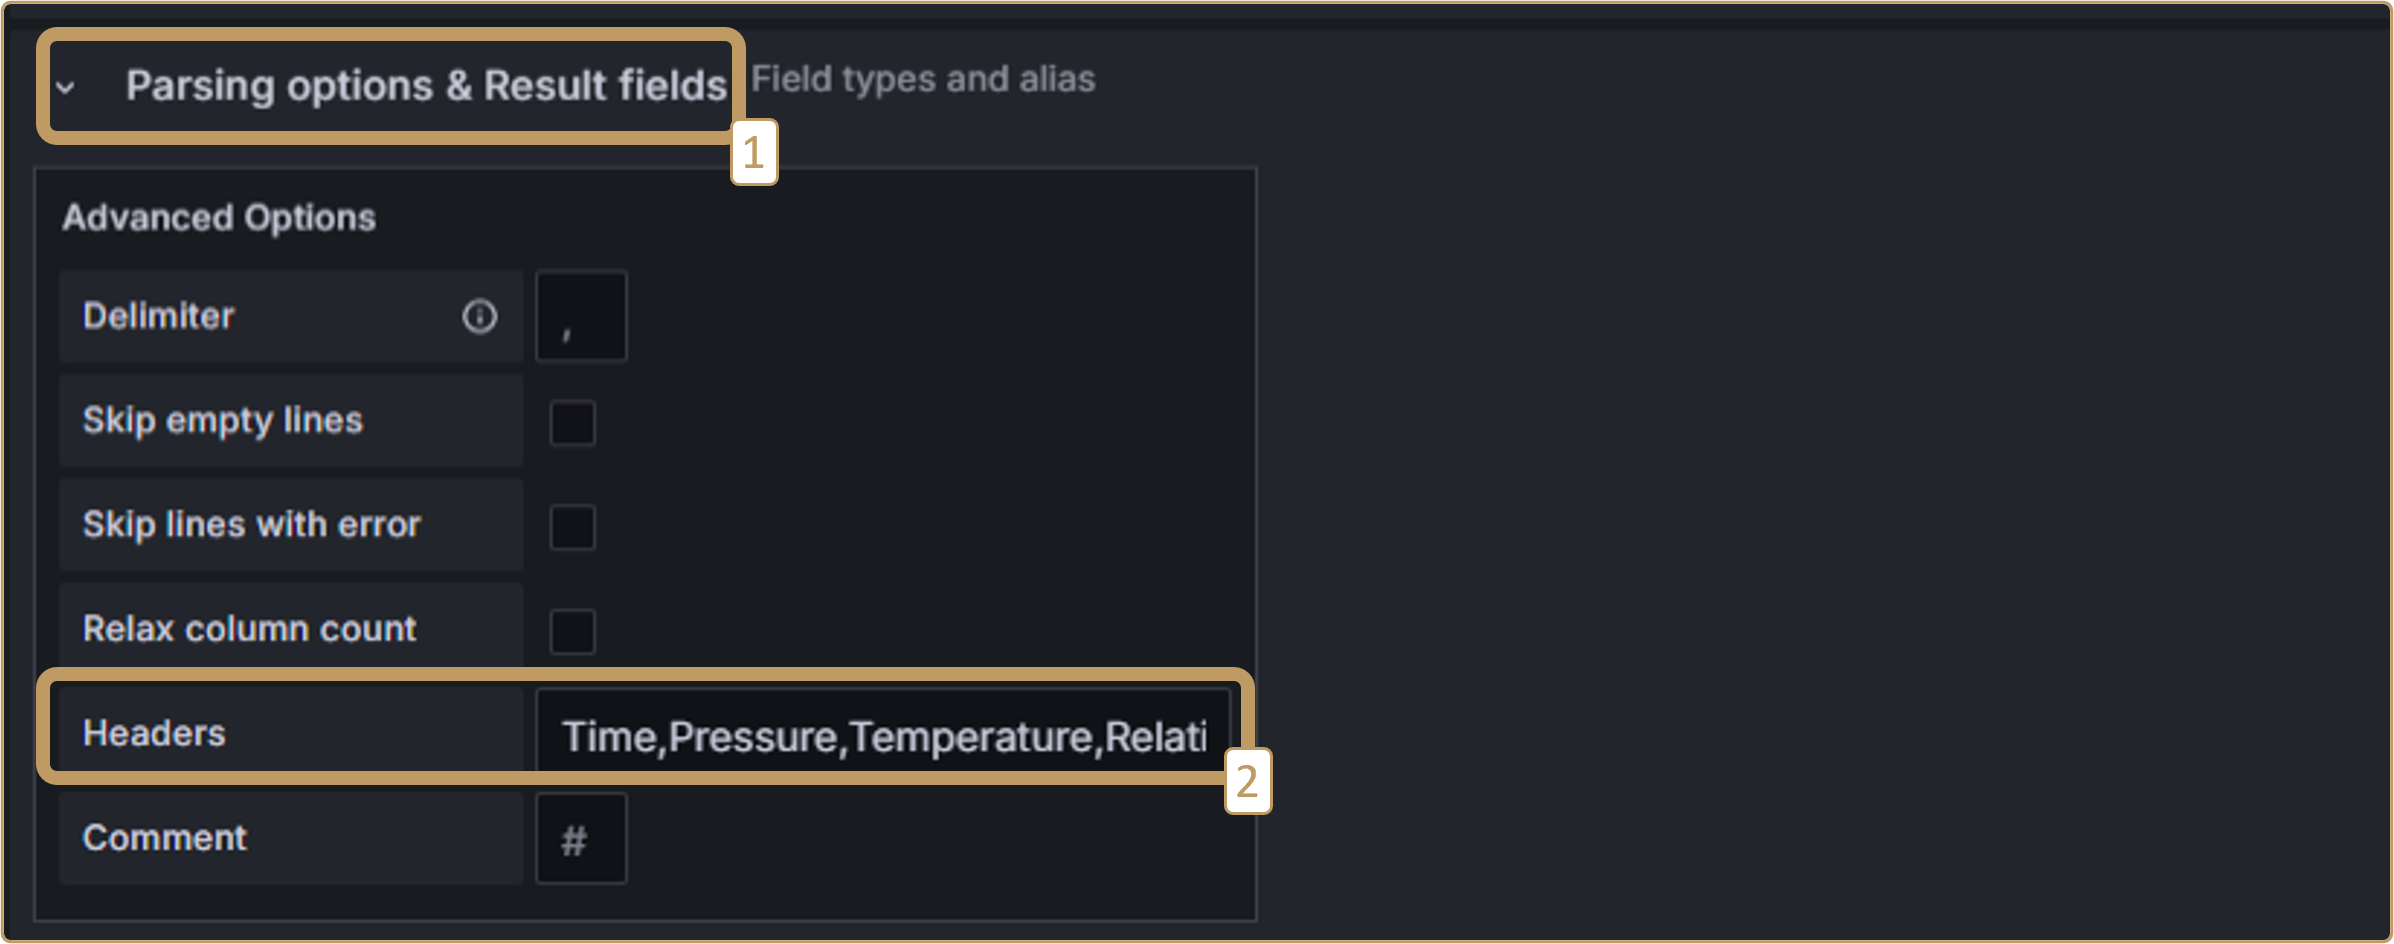
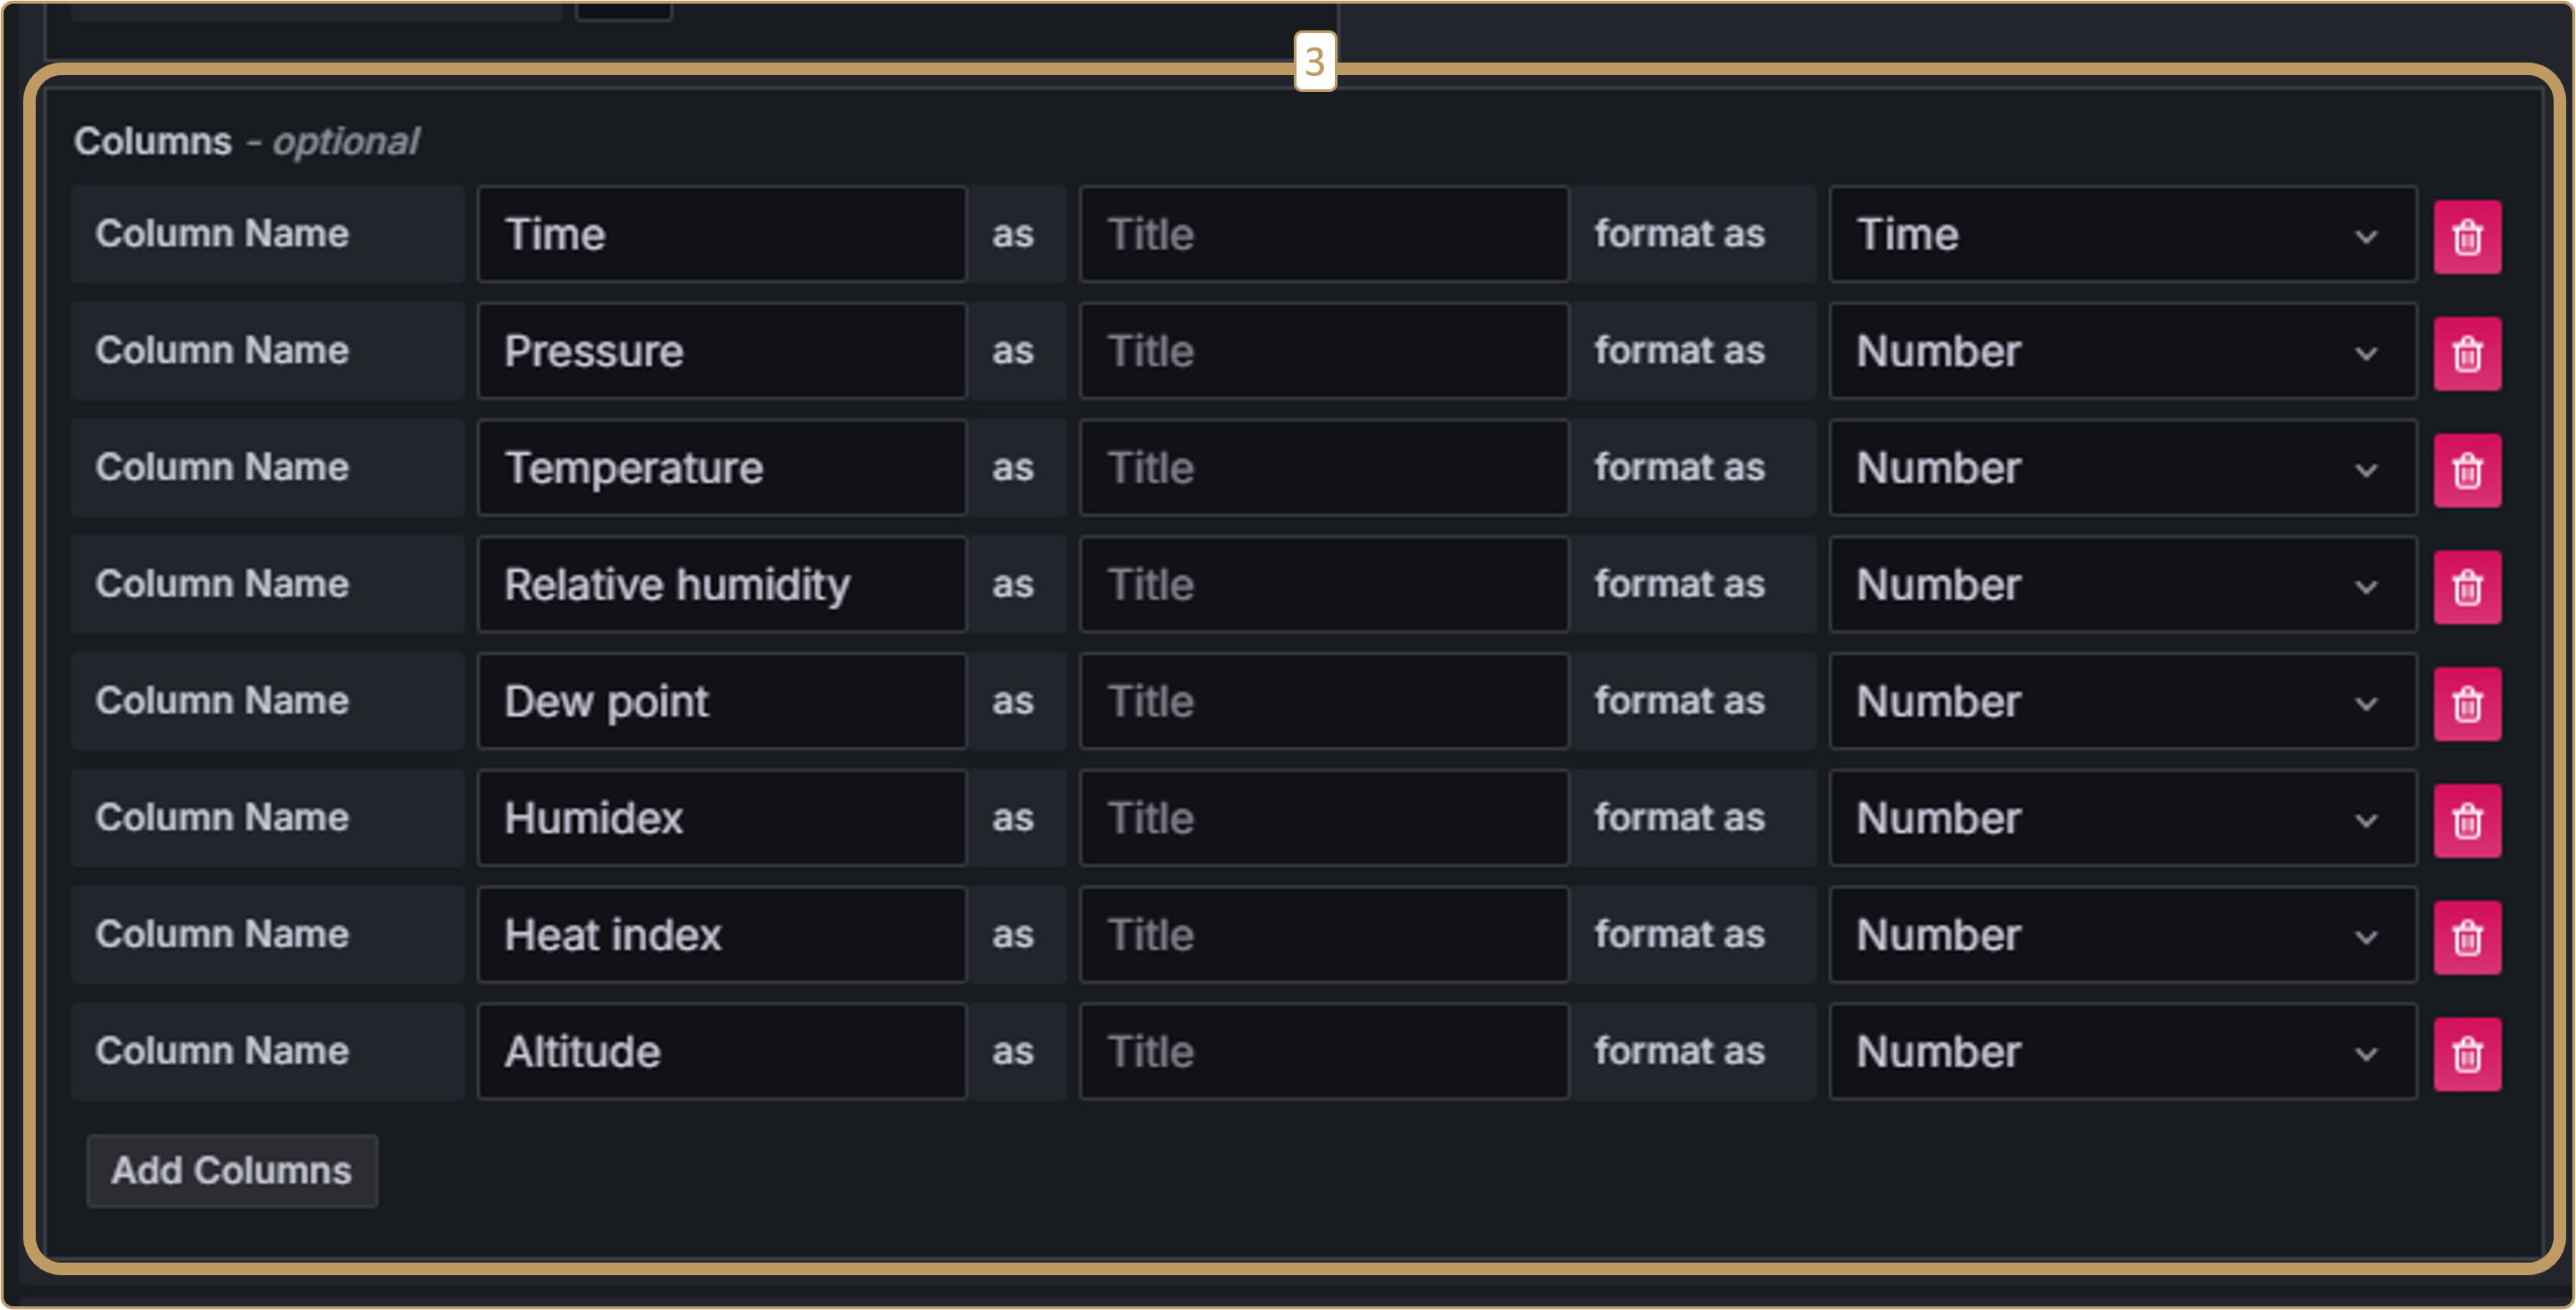
Now, just below, open the “Parsing options & Result fields” section. In“Headers” (location [2] in the image below), add “Time” followed by each channel separated by a comma, with no spaces. Then (point [3] below) add a column for each channel. Channel names must be identical and in the same order as in “Headers”. Choose the right format for each channel. For example, “Time” for time data and “Number” for values.
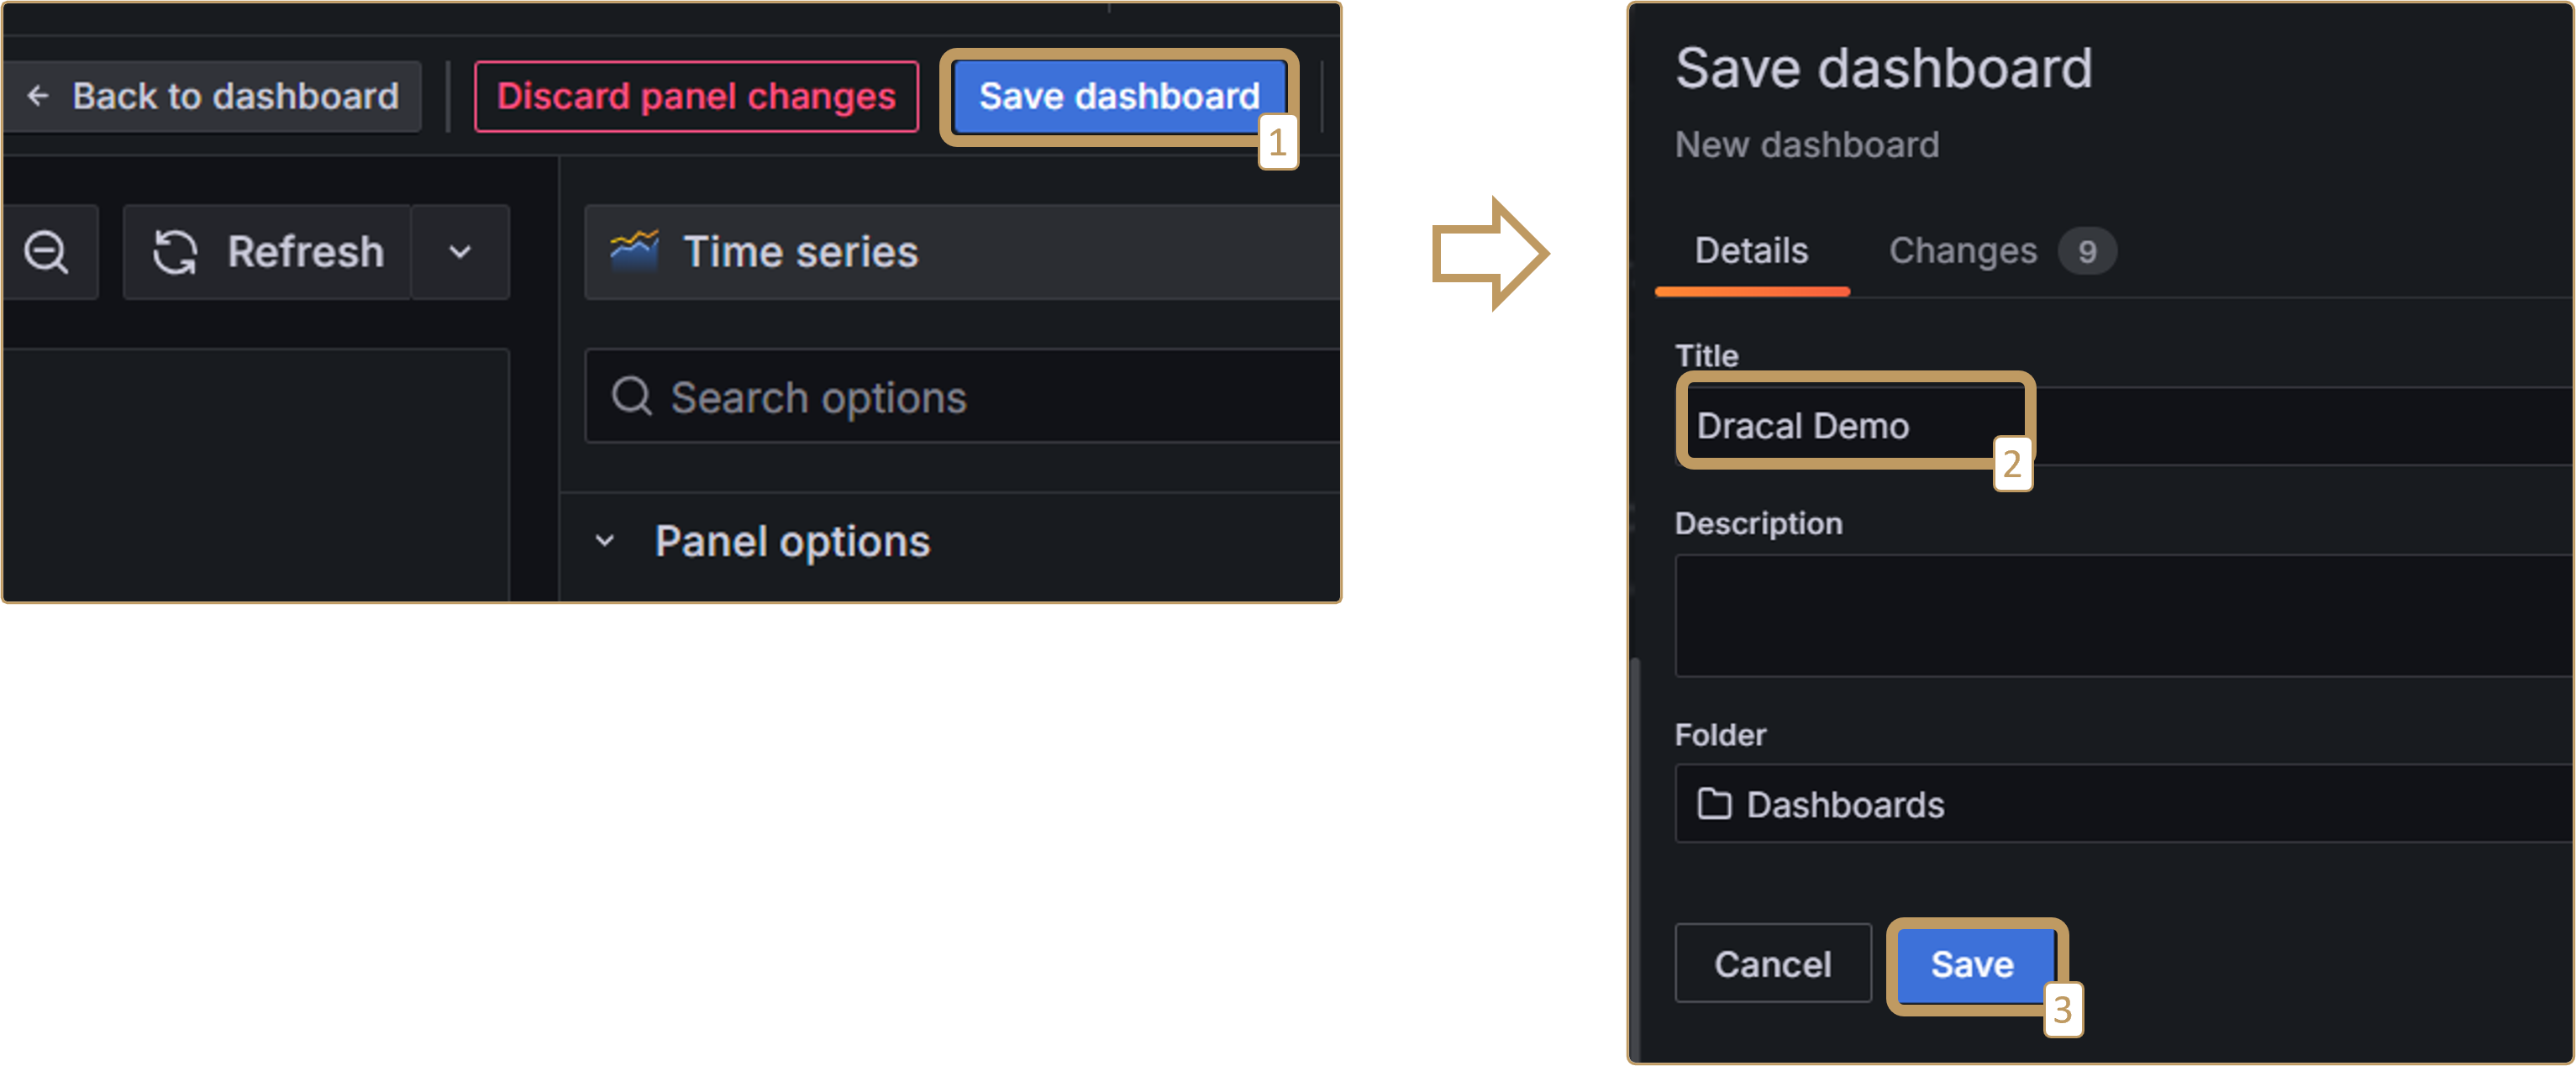
When the configuration is complete, refresh the graph with the “refresh” button at top right, then click on “Zoom to data”. You can select the channel to be displayed at the bottom if you have more than one. Finally, save and name your dashboard:
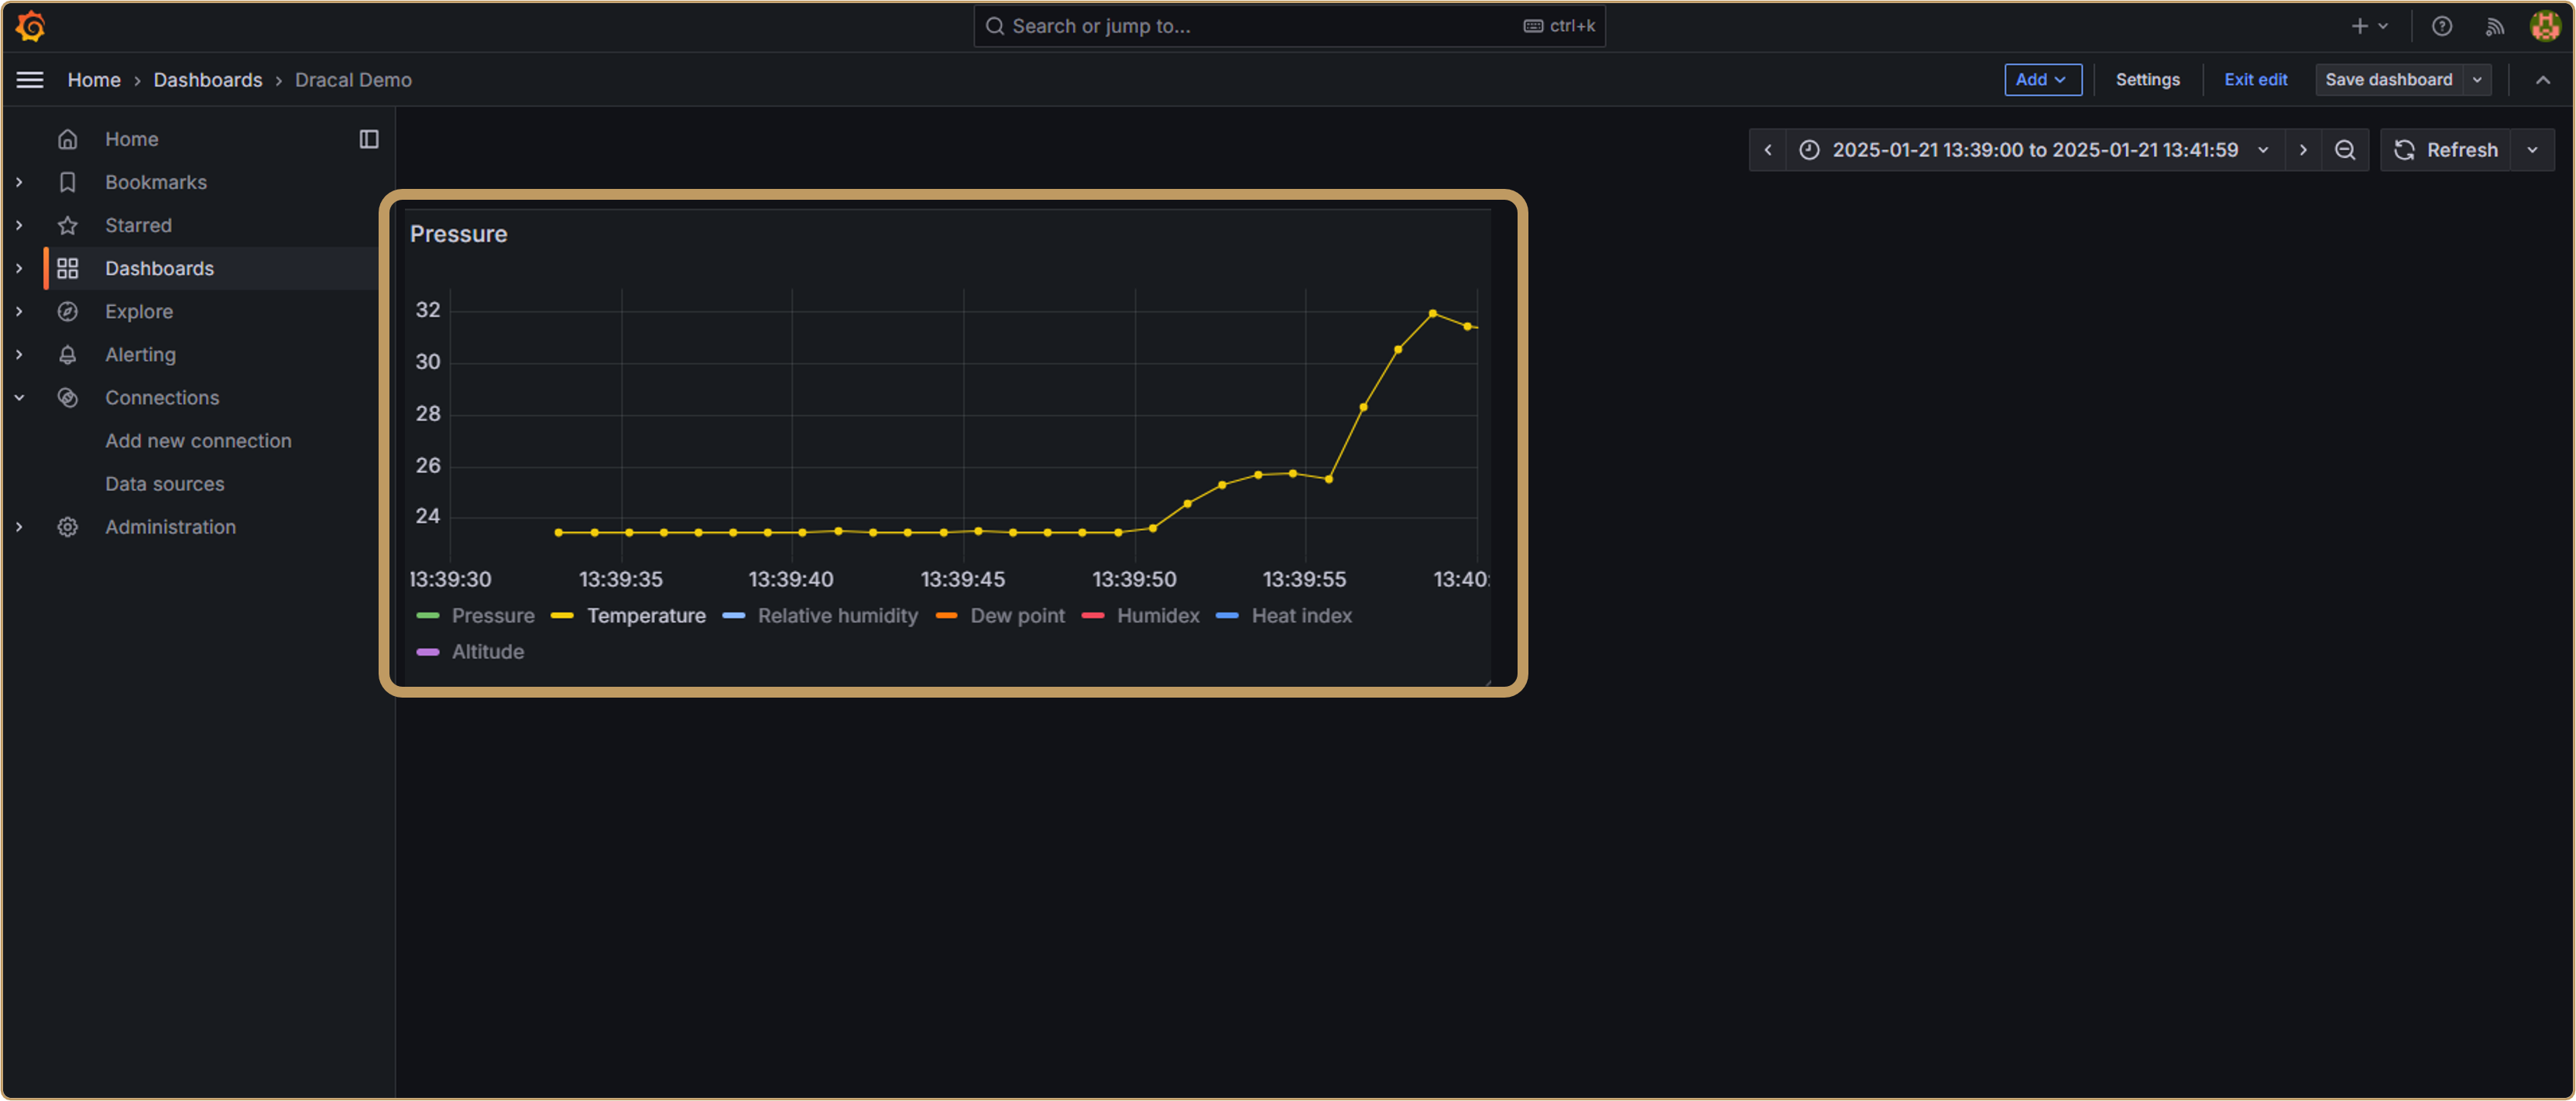
Visualization is now available in the dashboard:
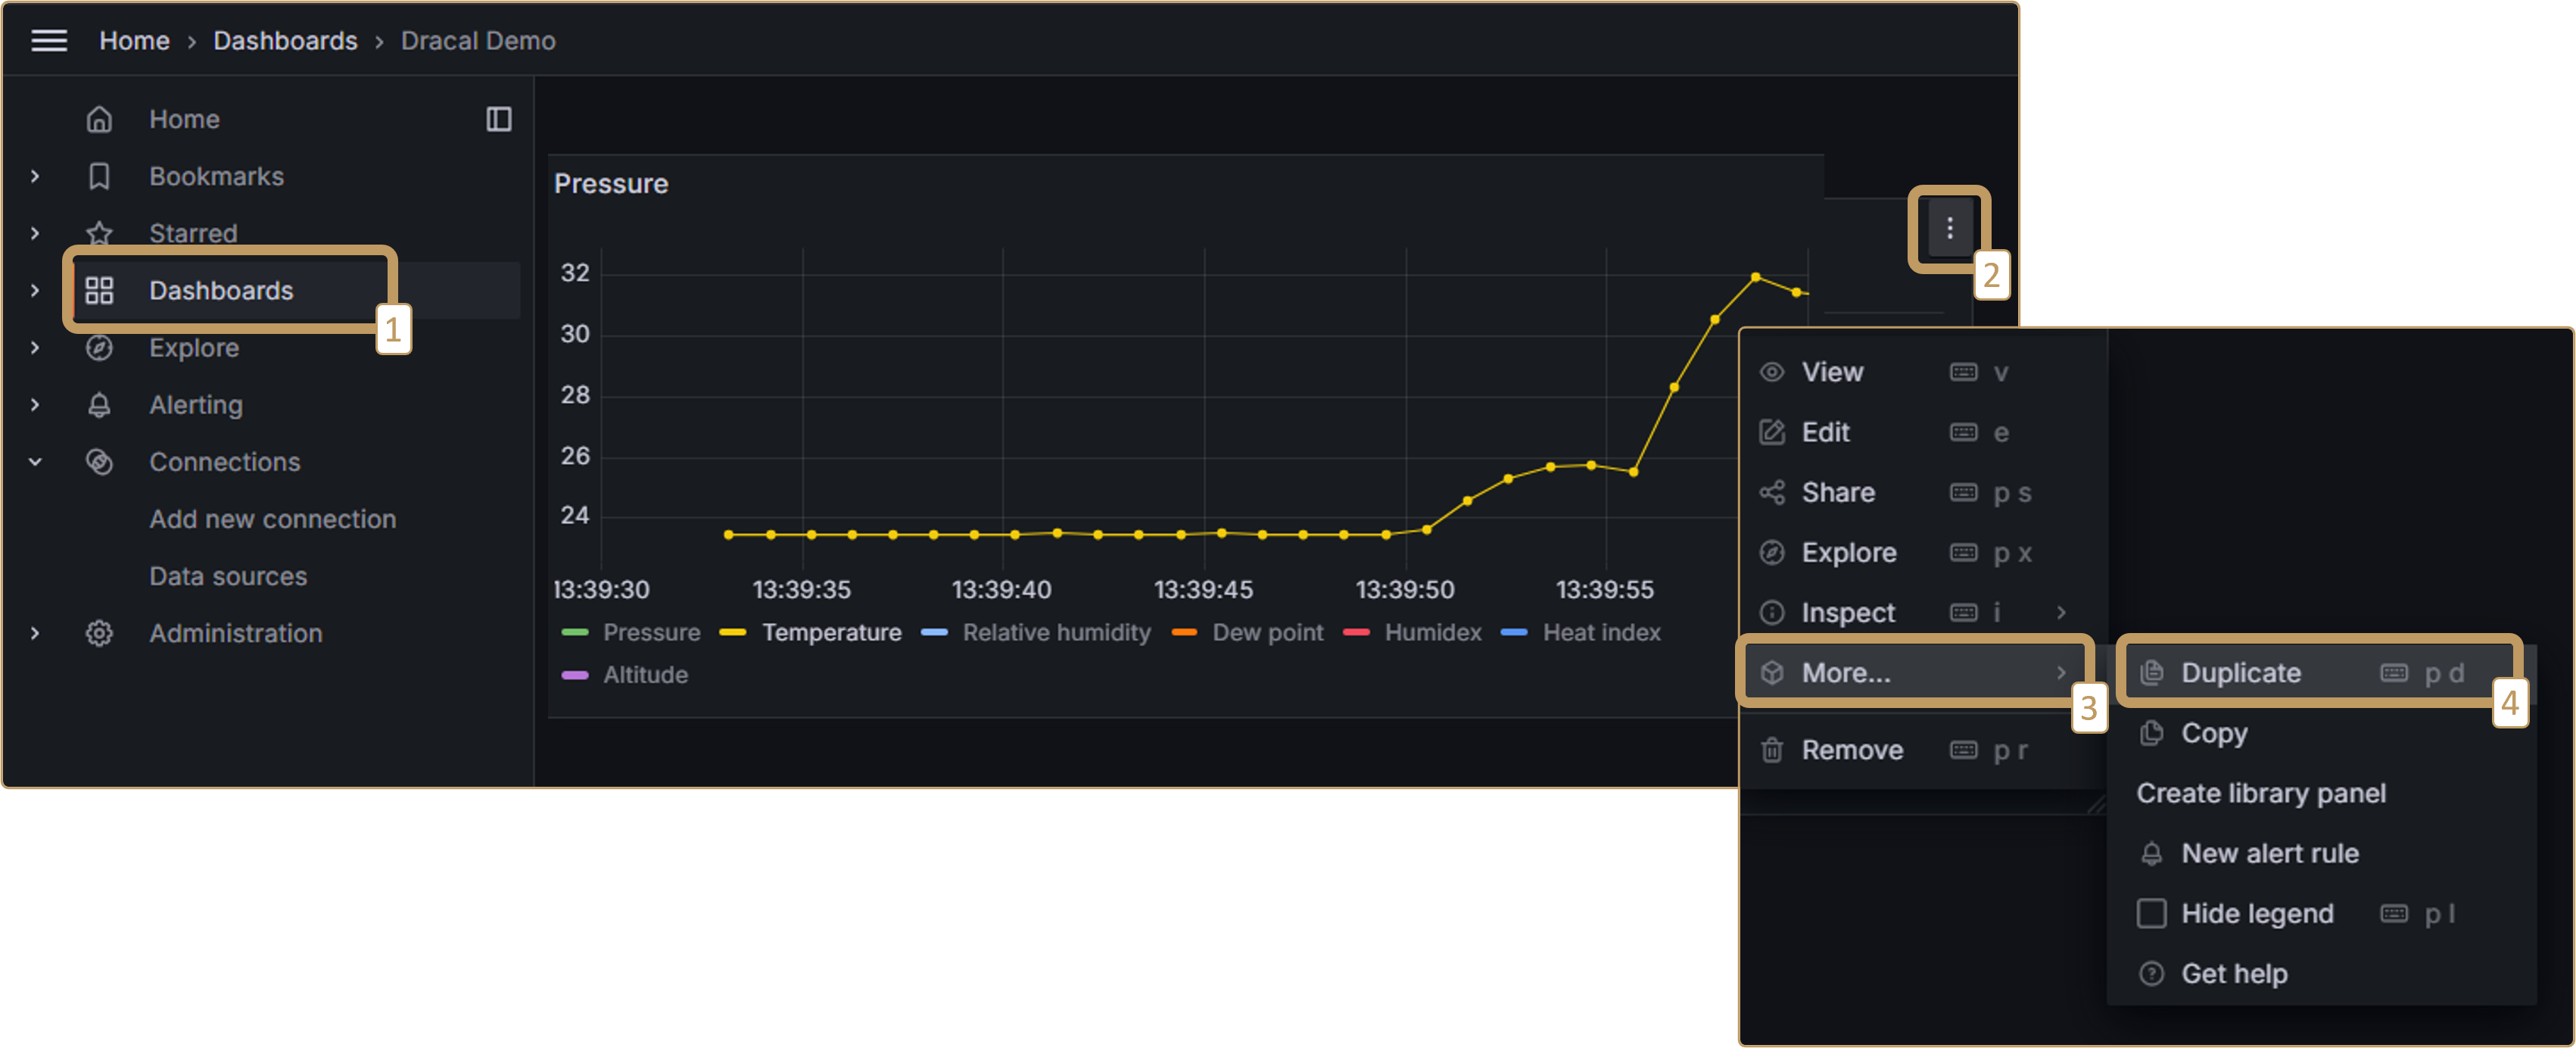
3.3. Duplicate visualization for another similar sensor
If you want to display a new graph for the same sensor type, or for different channels of the same data file, you don’t need to repeat all the steps. You can simply duplicate the graph (visualization) and use data from another CSV:
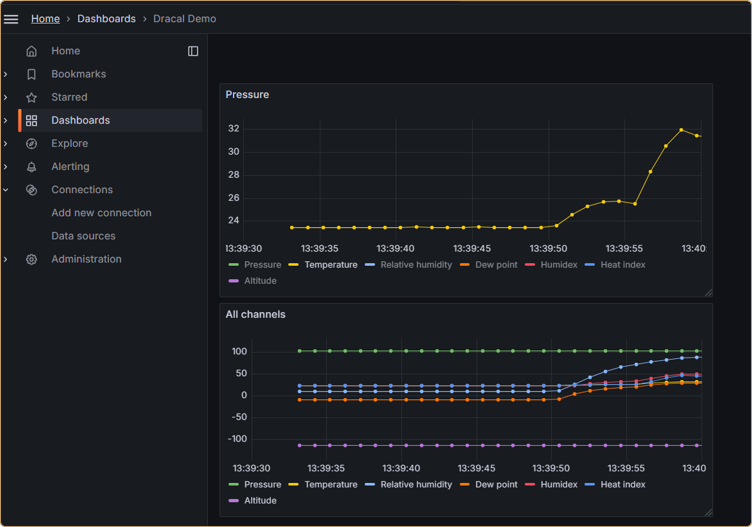
to obtain a result that will eventually look like this:
Conclusion
Grafana is the ideal tool for visualizing data from past log files. In this tutorial, we’ve shown you how, in just a few minutes, you can create visualizations from log files produced by Dracal Technologies’ free USB sensor tools. For real-time visualization, the DracalView graphics tool may be just what you need. For real-time visualization needs, you may also want to consider Grafana. Stay tuned, we are currently working on a tutorial for this too!
PRODUCTS YOU CAN TRUST
Approved by engineers, scientists and researchers around the world.
Thousands of companies trust our products worldwide:


Get reliable and ready-to-use precision measurements with Dracal
Always offered with our products!
EASY TO USE IN YOUR OWN APPLICATION
- Ready-to-use, accurate and robust real-time data flow
- Choose the interface that works best for you (CLI, virtual COM, REST API)
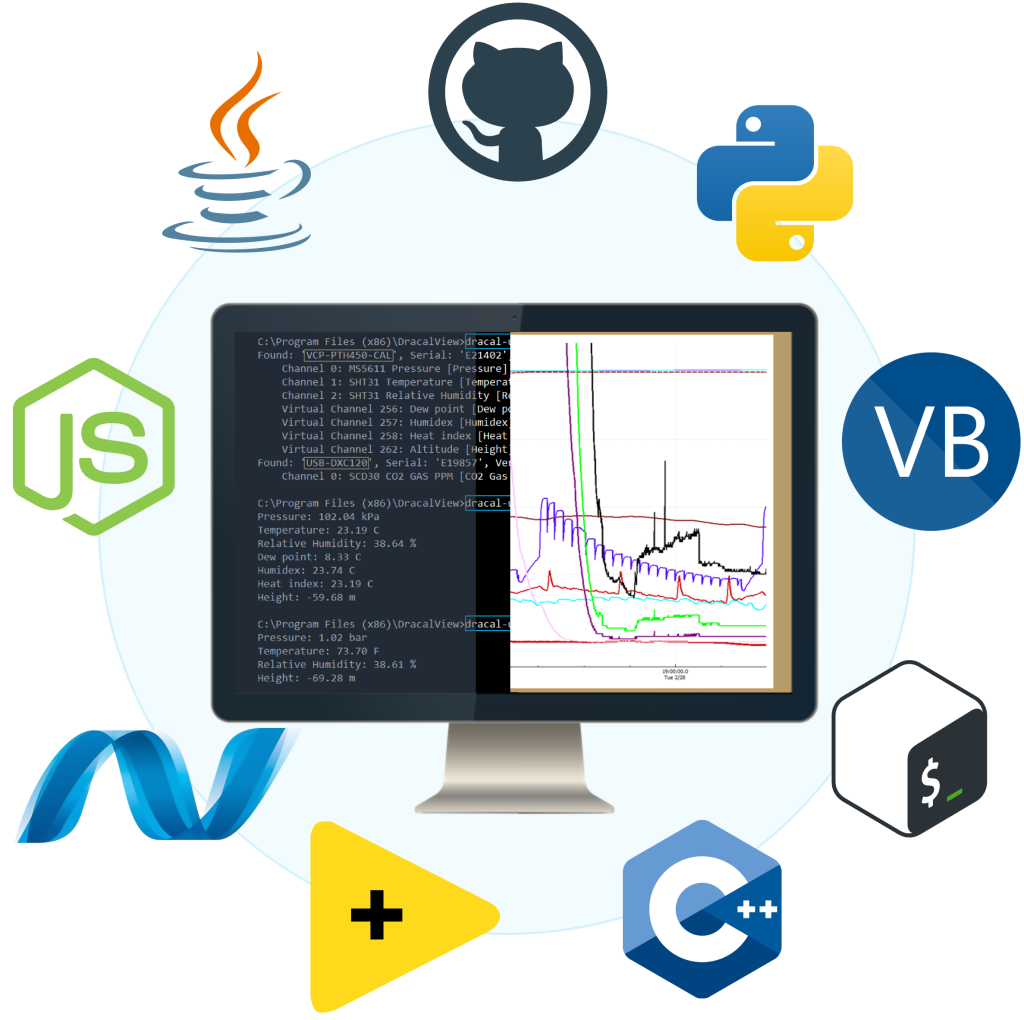
- Code samples available in 10+ programming languages (Python, C/C++, C#, Java, Node, .Net, etc.)
- Operates under Windows, Mac OS X and Linux
- Usable with LabView (CLI guide, Virtual COM guide)
- All tools packaged within one simple, free of charge, DracalView download
FREE DATA VISUALIZATION, LOGGING AND CALIBRATION SOFTWARE
- Get up-and-running in less than 3 minutes
- Operates under Windows, Mac OS X and Linux
- Real-time on-screen graphing and logging
- Log interval down to 0.5 second and configurable units (°C, °F, K…)
- Simultaneous use of unlimited Dracal sensors supported
- Simple user-calibration (products with the -CAL option)
- Connectivity with SensGate Wi-Fi/Ethernet gateway
Not sure if your project will benefit from Dracal’s solution?
Contact us, tell us about your project, and we’ll quickly determine if there’s a fit.
"*" indicates required fields